Box Plot from Scientific Research

CC-BY
17
Views
0
Likes
Citation
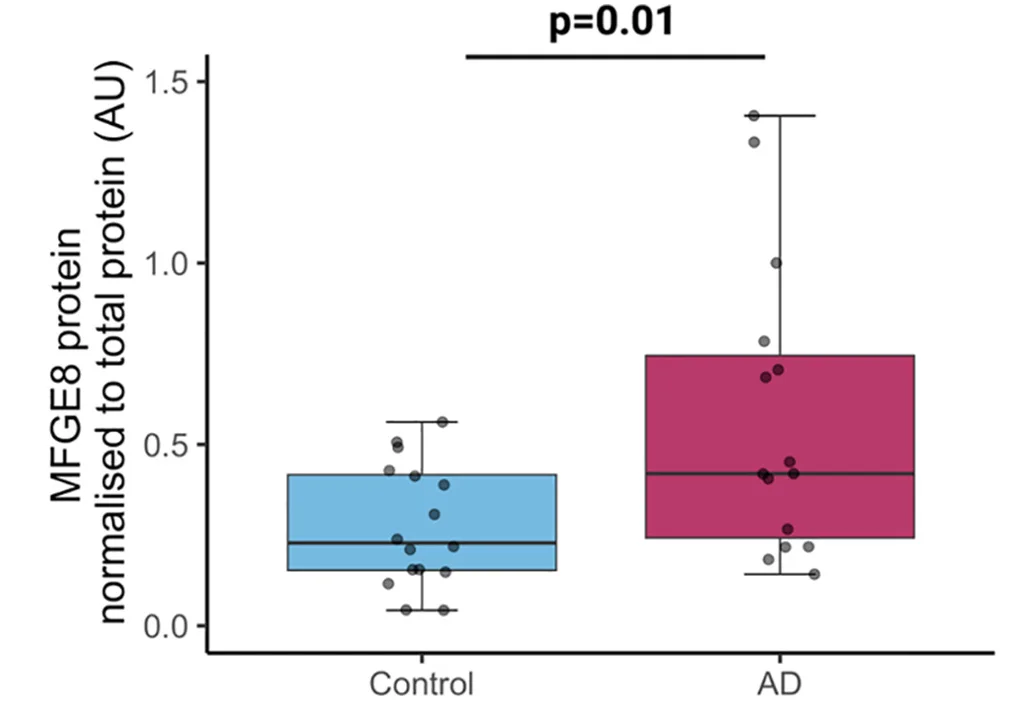
Quantification of dot blots in control (n = 16) and Alzheimers disease (AD) (n = 15) synaptoneurosomes shows significantly higher levels of MFG-E8 in AD samples compared with control ones (ANOVA after linear mixed effects model on Tukey transformed data, F[1,29] = 7.59, p = 0.01, human brain donor is biological replicate).
#Box Plot#Scatter Plot#Dot Blots#Synaptoneurosomes#MFG-E8#Control#Alzheimer's Disease#Quantification
Related Plots
Browse by Category
Popular Collections
Related Tags
Discover More Scientific Plots
Browse thousands of high-quality scientific visualizations from open-access research