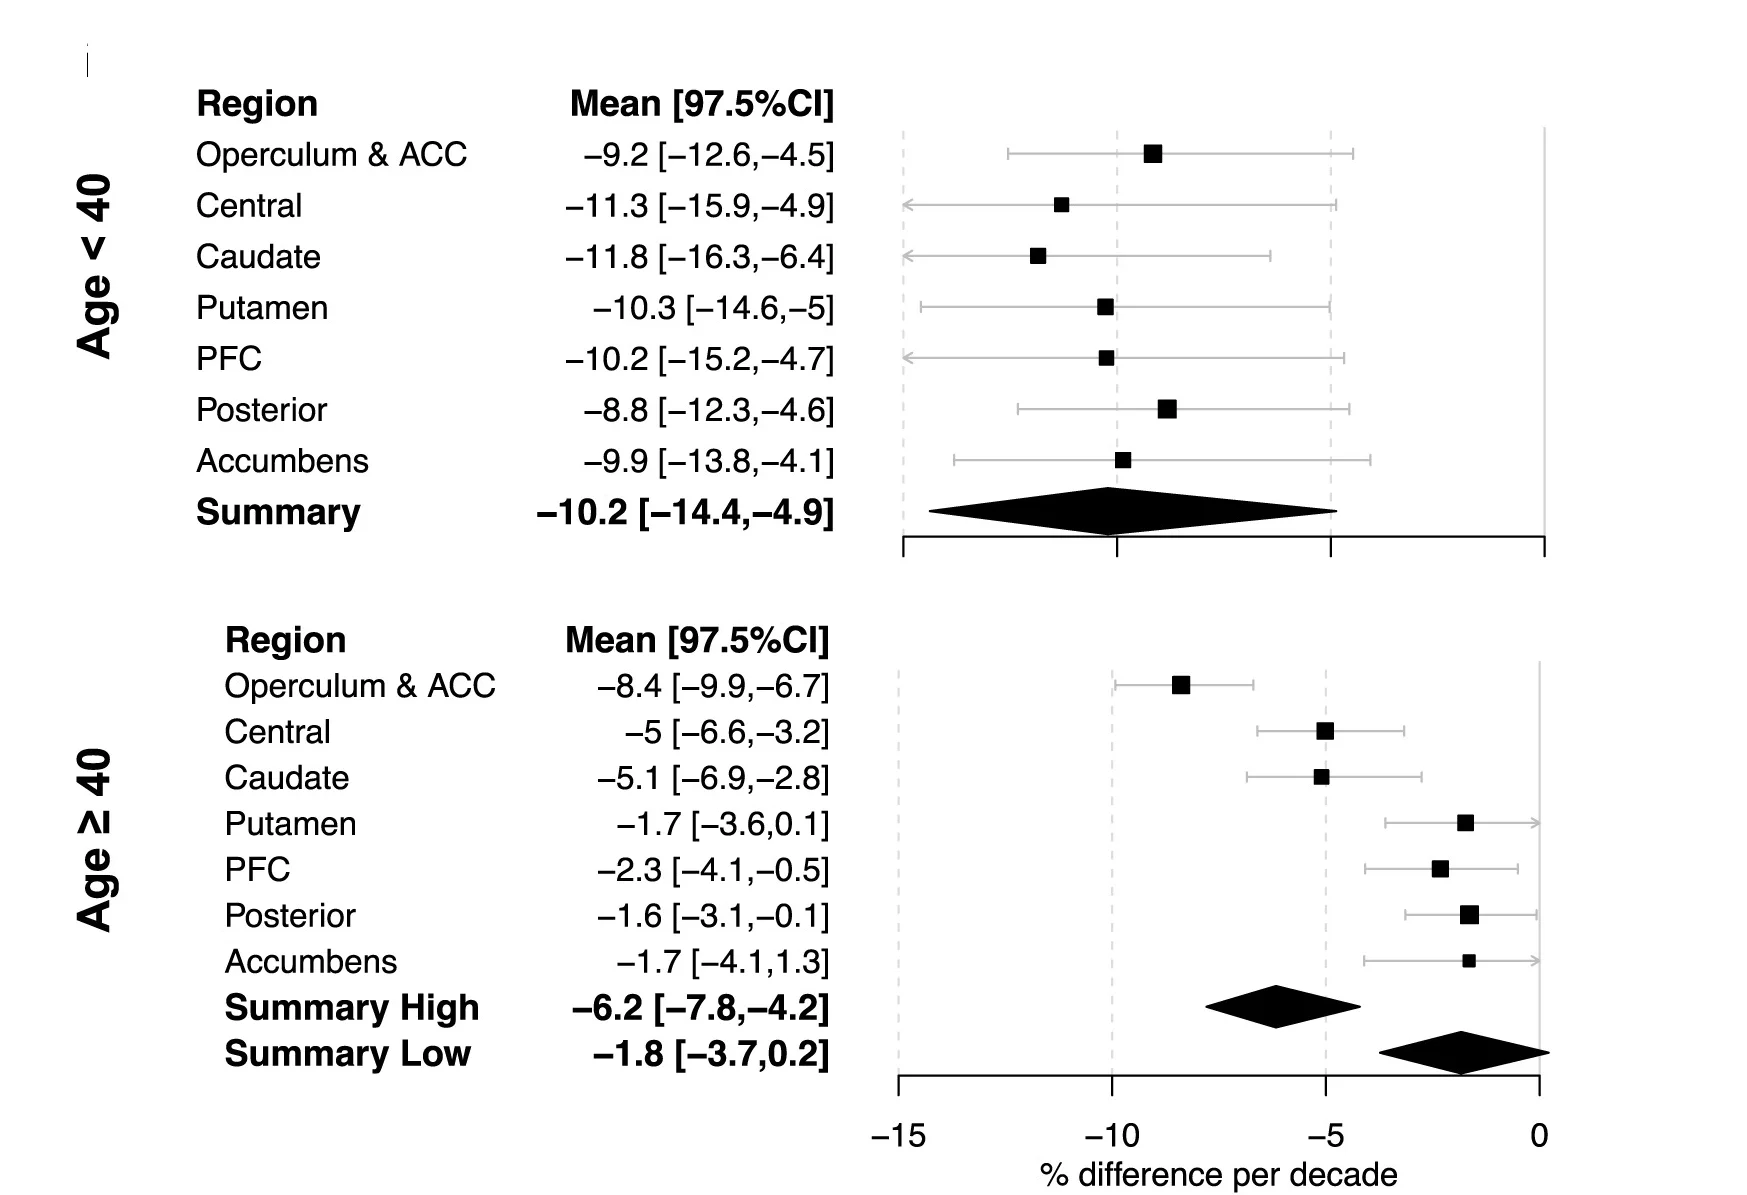
Forest Plot from Scientific Research

CC-BY
29
Views
0
Likes
Citation
D1DR percentage of difference per decade (seeSTAR Methods) for participants younger (top) and older (bottom) than 40. Bootstrapping (n = 500) was used for estimation of mean (box) and 95% CI (whiskers) of percentage of difference per decay. Non-overlapping CIs were interpreted as significant rate differences (p < 0.05).
#Forest Plot#Error Bars#D1DR Percentage#Difference per Decade#Participants#Bootstrapping#Confidence Intervals#Rate Differences
Related Plots
Browse by Category
Popular Collections
Related Tags
Discover More Scientific Plots
Browse thousands of high-quality scientific visualizations from open-access research