Violin Plot from Scientific Research

CC-BY
33
Views
0
Likes
Citation
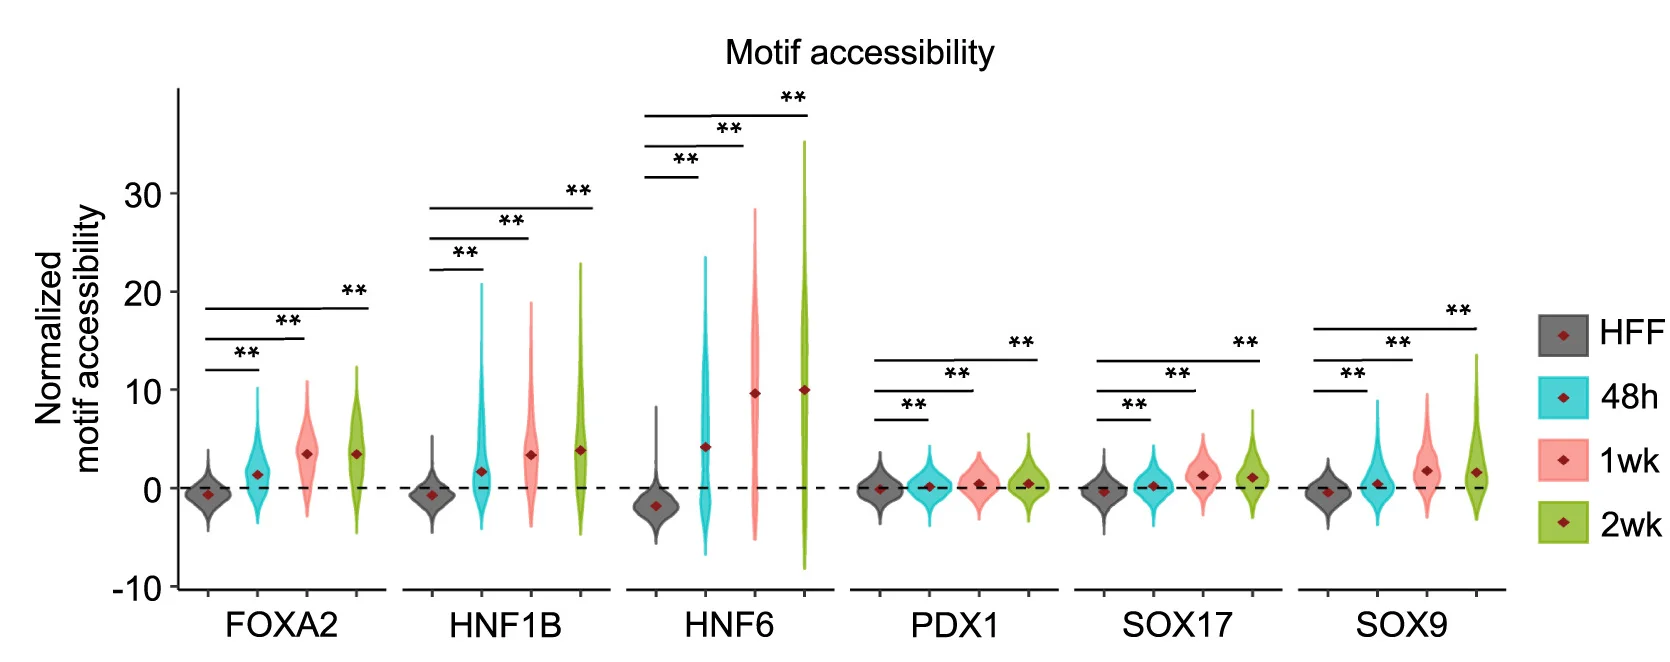
Violin plot showing the motif accessibility scores (Zscores) of individual TFs in the cells with 6F pool at three time points and in HFFs. (D–G) Two-sided Wilcoxon rank-sum test, FDR from Benjamini-Hochberg (BH) adjusted p values; n.s., not significant;*FDR < 0.01.**FDR < 0.001. See also Figures S4–S6.
#Violin Plot#Motif Accessibility Scores#Zscores#TFs#Cells#6F Pool#Time Points#HFFs#Wilcoxon Rank-Sum Test#FDR#P Values
Related Plots
Browse by Category
Popular Collections
Related Tags
Discover More Scientific Plots
Browse thousands of high-quality scientific visualizations from open-access research