Bar Plot from Scientific Research

CC-BY
4
Views
0
Likes
Citation
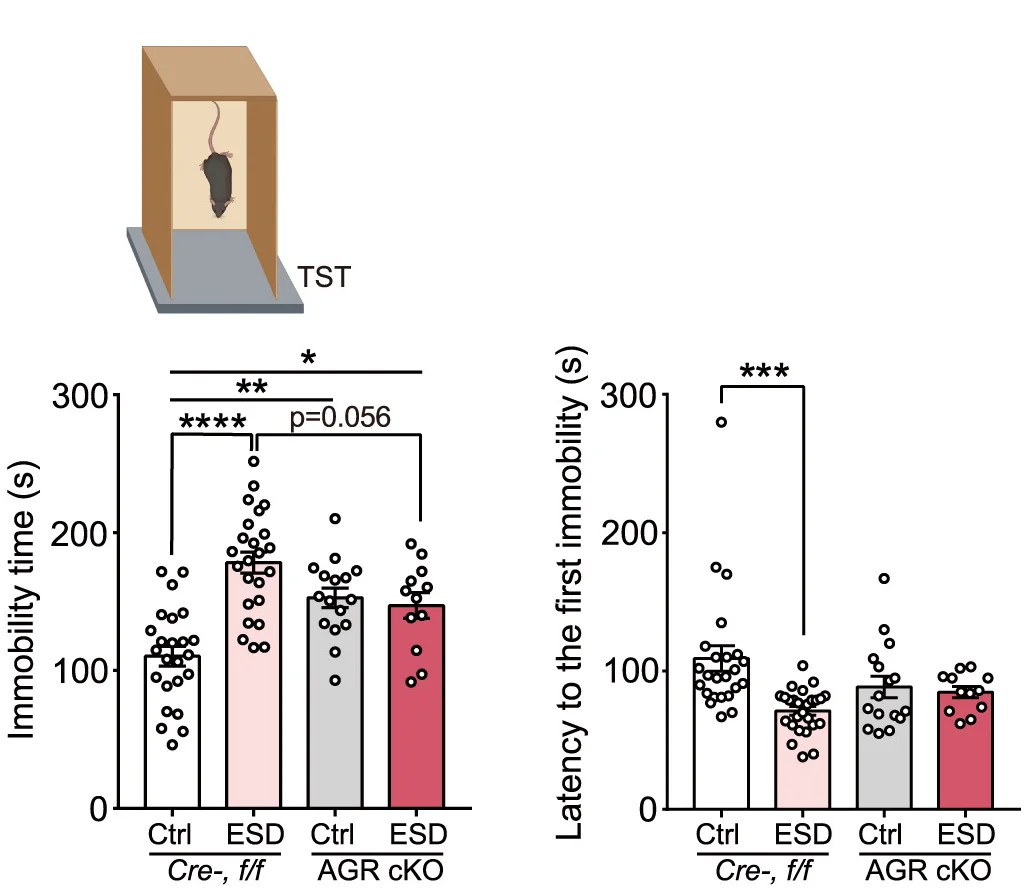
Schematic illustration of the behavioral tests and bar graph showing the results from Cre−control, Cre−ESD, AGR cKO control, and AGR cKO ESD groups. Depressive behaviors measured by the TST (mean duration of immobility [left] and mean latency to the first immobility episode [right]). Note that all behavioral symptoms observed in Cre−ESD mice were substantially normalized in the AGR cKO ESD mice. n = 24 for Cre−control mice; n = 24 for Cre−ESD mice; n = 16 for AGR cKO control mice; n = 12 for AGR cKO ESD mice.
#Bar Plot#Error Bars#Scatter Plot#Behavioral tests#Bar graph#Cre−control#Cre−ESD#AGR cKO control#AGR cKO ESD#Depressive behaviors#TST#Immobility duration#Latency to first immobility
Related Plots
Browse by Category
Popular Collections
Related Tags
Discover More Scientific Plots
Browse thousands of high-quality scientific visualizations from open-access research