Line Plot from Scientific Research

CC-BY
1
Views
0
Likes
Citation
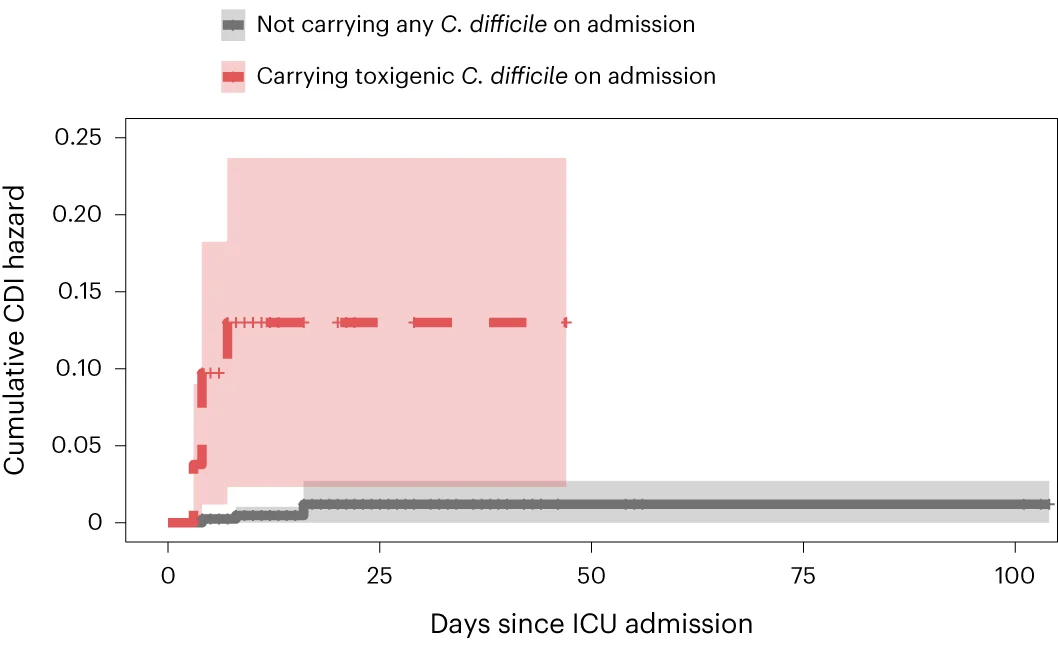
Cumulative hazard curves depicting the unadjusted risk of developing a healthcare-associated CDI during hospitalization among patients who carried toxigenic C. difficile on admission to the ICU (red) compared to those who did not carry any (gray). Patients carrying toxigenic strains on admission were at significantly increased risk of hospital-onset CDI compared to admission-negative patients (log-rank test, P = 3 x 10 -13). The thick lines indicate the estimated cumulative hazard in the designated group. The vertical lines indicate censored patients. The shaded areas indicate the 95% confidence bands.
#Line Plot#Error Bars#Survival Curve#Cumulative Hazard Curves#Healthcare-Associated CDI#Toxigenic C. difficile#ICU#Hospital-Onset CDI
Related Plots
Browse by Category
Popular Collections
Related Tags
Discover More Scientific Plots
Browse thousands of high-quality scientific visualizations from open-access research