Scatter Plot from Scientific Research

CC-BY
0
Views
0
Likes
Citation
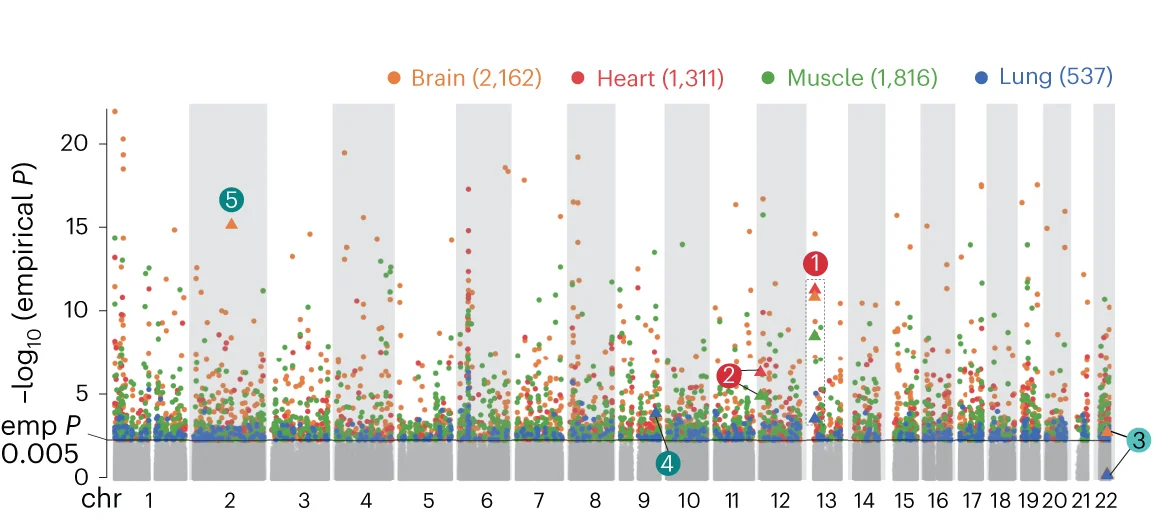
Overlaid Manhattan plot of lead haQTLs from brain, heart, muscle and lung; x axis shows the genomic position and y axis shows the -log 10 (empirical P value); empirical P value is haQTL P value adjusted for multiple SNPs for each loci as described in Methods ; examples 1–5 in b are marked with numbers in colored circles.
Related Plots
Browse by Category
Popular Collections
Related Tags
Discover More Scientific Plots
Browse thousands of high-quality scientific visualizations from open-access research