Bar Plot from Scientific Research

CC-BY
1
Views
0
Likes
Citation
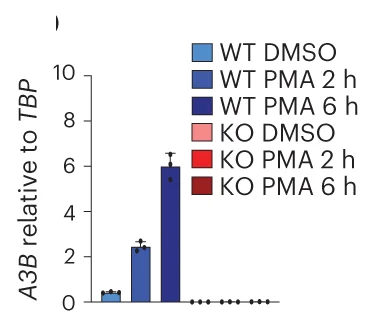
RTqPCR of A3B mRNA from MCF10A WT and A3B KO cells treated with PMA (25 ng ml −1 ) for the indicated times. Values are expressed relative to the housekeeping gene, TBP ( n = 3; mean ± s.e.m.; KO levels not detectable).
Related Plots
Browse by Category
Popular Collections
Related Tags
Discover More Scientific Plots
Browse thousands of high-quality scientific visualizations from open-access research