UMAP from Scientific Research

CC-BY
2
Views
0
Likes
Citation
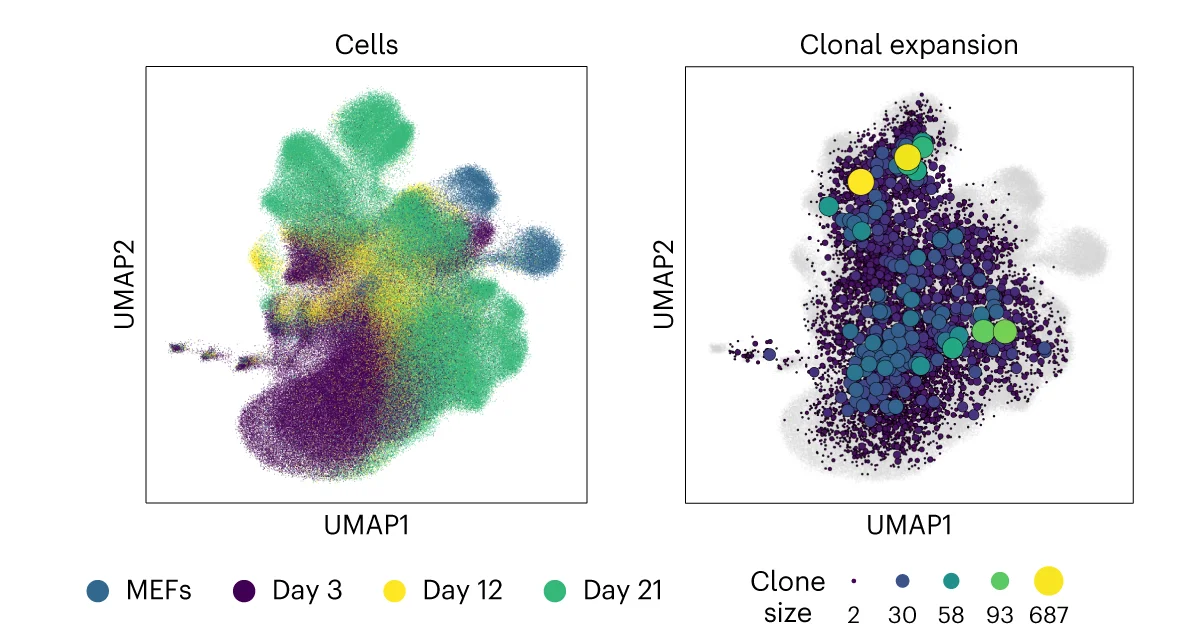
Cells from both scRNA-seq and scATAC-seq, across all time points, were co-embedded with clones and visualized using a UMAP. Left, time point information projected on cells. Right, clonal expansion visualized using clone nodes.
Related Plots
Browse by Category
Popular Collections
Related Tags
Discover More Scientific Plots
Browse thousands of high-quality scientific visualizations from open-access research