Line Plot from Scientific Research

CC-BY
0
Views
0
Likes
Citation
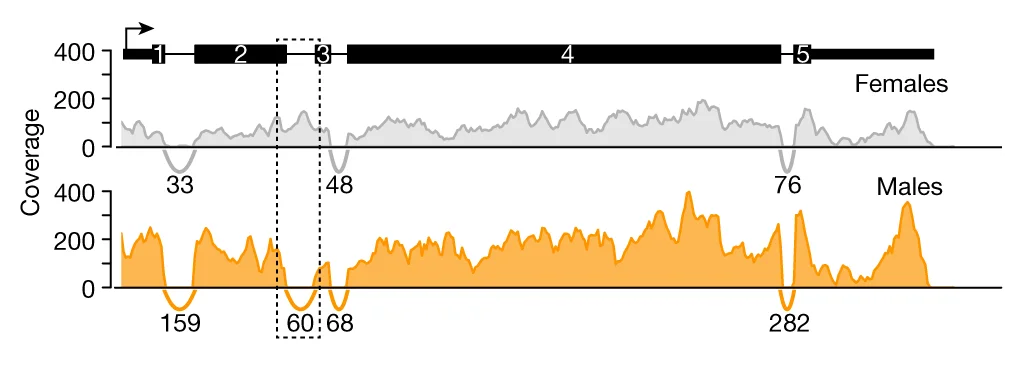
RNA-seq coverage and splice junctions (arcs) at the SOA locus at 11 h of embryogenesis in females and males. Read numbers spanning respective exon–exon junctions are shown below the arcs (Supplementary Table 1).
#Line Plot#Density Plot#RNA-seq Coverage#Splice junctions#SOA locus#Embryogenesis#Females#Males#Exon-exon junctions
Related Plots
Browse by Category
Popular Collections
Related Tags
Discover More Scientific Plots
Browse thousands of high-quality scientific visualizations from open-access research