Scatter Plot from Scientific Research

CC-BY
1
Views
0
Likes
Citation
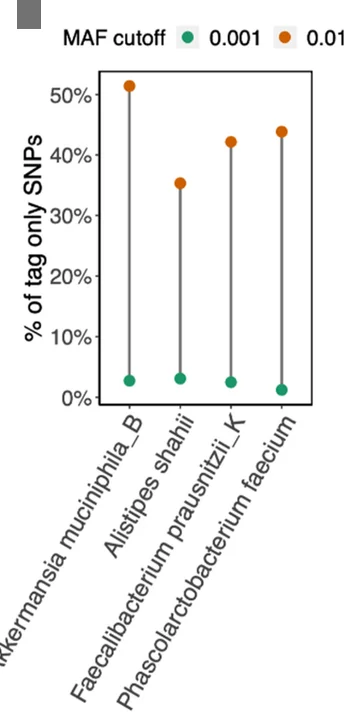
SNP sites missing from a small percentage of genome assemblies as they fall below the user-specified prevalence threshold due to being absent in a group of redundant genomes. Connected dots represent example species in c with a high proportion of tag-only SNPs. The proportion of tag-only SNPs drops if the MAF cutoff for calling SNPs with all genomes is lowered from 0.01 (orange) to 0.001 (green). Most of the SNPs only discovered with tag genomes (tag-only SNPs) are due to MAFs below the 1% threshold in all genomes.
Related Plots
Browse by Category
Popular Collections
Related Tags
Discover More Scientific Plots
Browse thousands of high-quality scientific visualizations from open-access research