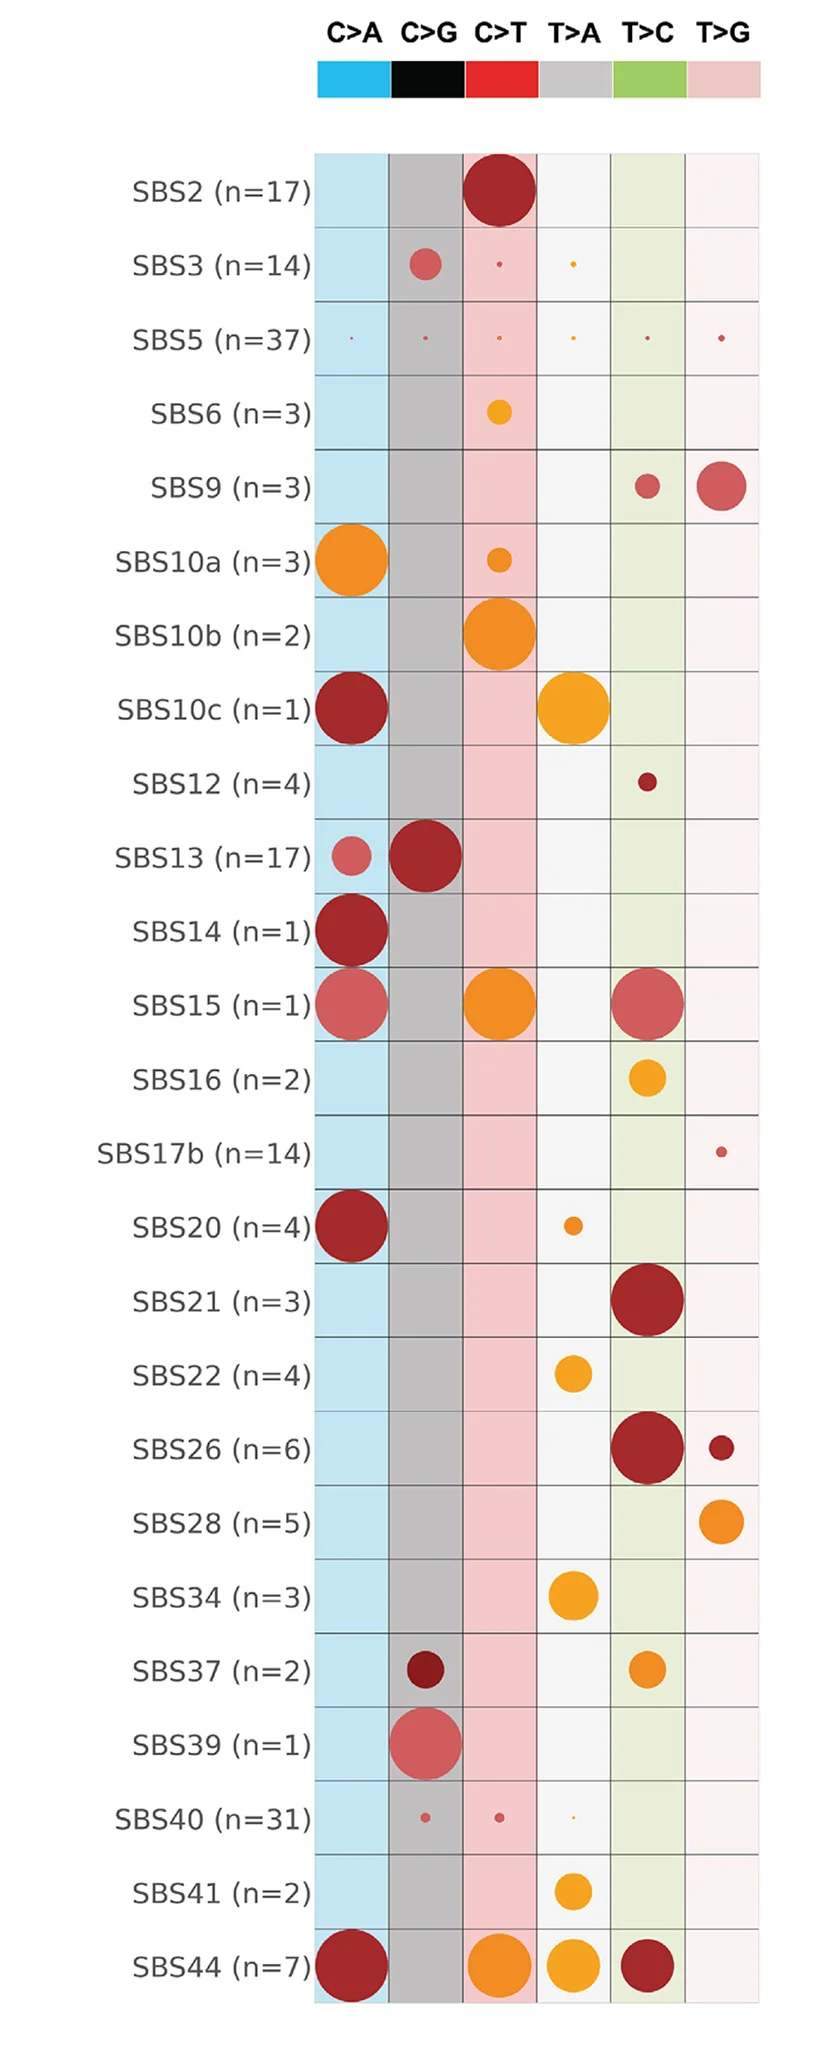
Bubble Plot from Scientific Research

Citation
Replication strand asymmetries of SBS signatures. Rows represent the signatures, where n reflects the number of cancer types in which each signature was found. Columns display the six substitution subtypes based on the mutated pyrimidine base: C>A, C>G, C>T, T>A, T>C, and T>G. SBS signatures with replicational strand asymmetries on the lagging strand or on the leading strand with adjusted p values ≤0.05 (Fisher's exact test corrected for multiple testing using Benjamini-Hochberg) are shown in circles with red and yellow colors, respectively. The color intensity reflects the odds ratio between the ratio of real mutations and the ratio of simulated mutations, where each ratio is calculated using the number of mutations on the lagging strand and the number of mutations on the leading strand. Only odds ratios above 1.10 are shown. Circle sizes reflect the proportion of cancer types exhibiting a signature with specific replication strand asymmetry.
Related Plots
Browse by Category
Popular Collections
Discover More Scientific Plots
Browse thousands of high-quality scientific visualizations from open-access research