Heatmap from Scientific Research

CC-BY
6
Views
0
Likes
Citation
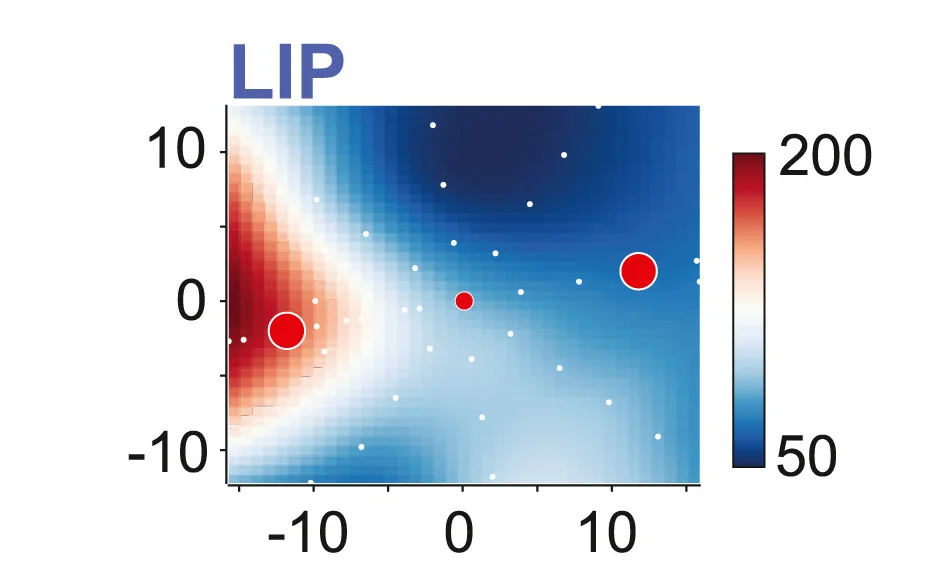
The RF of an example LIP neuron. The color map depicts the mean firing rate, interpolated across target locations (white circles), during the delay epoch of a visually guided saccade task. Red circles depict the location of the choice targets in the RDM task in this session.
#Heatmap#Scatter Plot#Bubble Plot#Receptive field#Lateral intraparietal area Neuron#Firing rate#Saccade task#Choice targets
Related Plots
Browse by Category
Popular Collections
Related Tags
Discover More Scientific Plots
Browse thousands of high-quality scientific visualizations from open-access research