Scatter Plot from Scientific Research

CC-BY
0
Views
0
Likes
Citation
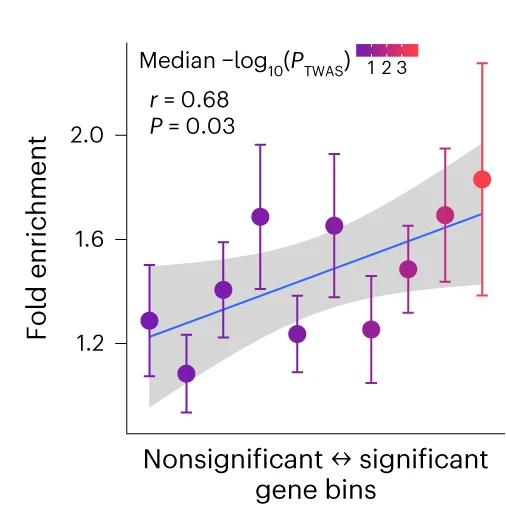
Pearson’s r between TWAS significances (color bar) of genes in pig BFT and their heritability enrichments (mean ± s.e.) in human weight. The orthologous genes were divided into ten evenly spaced bins by sorting the P values of TWAS in the brain of pig BFT. Shading: standard error of the fitting line.
#Scatter Plot#Regression Plot#Error Bars#Pearson’s r#TWAS Significances#Pig BFT#Heritability Enrichments#Human Weight#Orthologous Genes#TWAS#Brain
Related Plots
Browse by Category
Popular Collections
Related Tags
Discover More Scientific Plots
Browse thousands of high-quality scientific visualizations from open-access research