Bar Plot from Scientific Research

CC-BY
2
Views
0
Likes
Citation
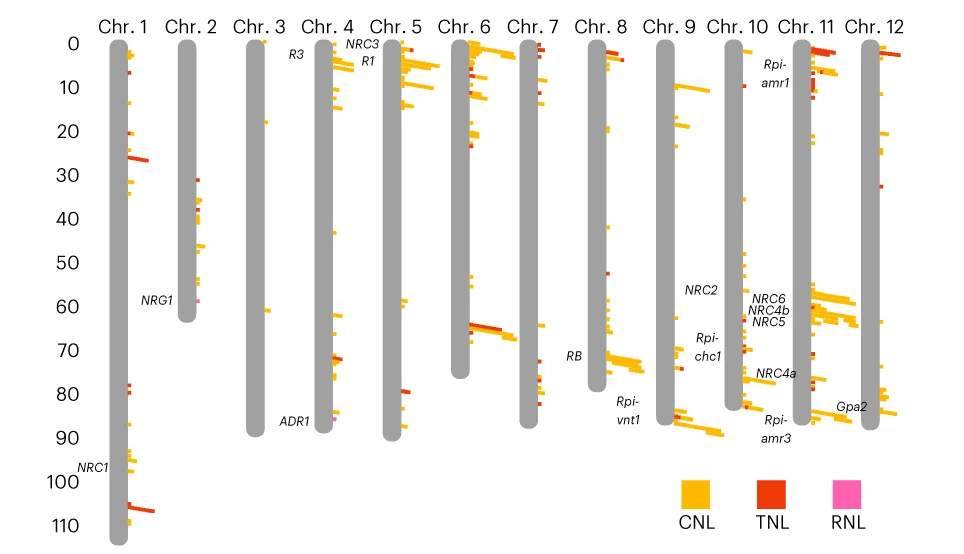
The physical map of NLR genes in the SP1102 genome. CNLs are shown by yellow blocks, TNLs are shown by red blocks and RNLs are shown by pink blocks. Some functionally characterized NLR clusters are noted on this map. Some previously reported NLR clusters ( NRC1 , NRG1 , R3 , ADR1 , NRC3 , R1 , RB , Rpi-vnt1 , NRC2 , Rpi-chc1 , Rpi-amr1 , NRC6 , NRC4b , NRC5 , NRC4a , Rpi-amr3 , Gpa2 ) are shown in the physical map.
Related Plots
Browse by Category
Popular Collections
Discover More Scientific Plots
Browse thousands of high-quality scientific visualizations from open-access research