Line Plot from Scientific Research

CC-BY
8
Views
0
Likes
Citation
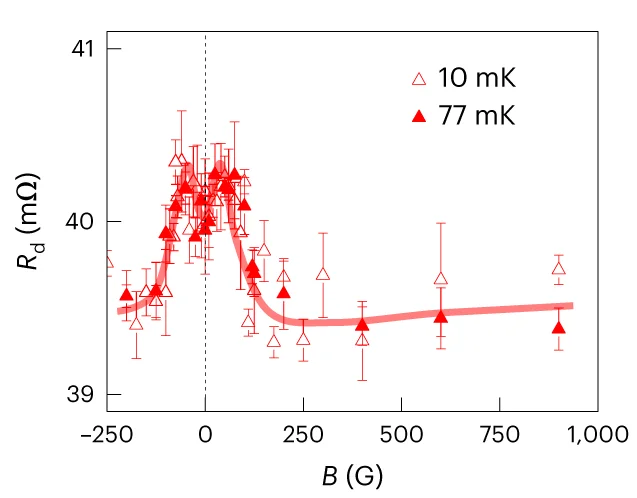
Magnetic-field-dependent R d at 10 and 77 mK, showing a small dip in the low-magnetic-field regime. The solid lines are guides to the eye. Error bars in a and b represent the standard error of the mean due to repeated measurements (Supplementary Section 1 ).
Related Plots
Browse by Category
Popular Collections
Discover More Scientific Plots
Browse thousands of high-quality scientific visualizations from open-access research