Manhattan Plot from Scientific Research

CC-BY
16
Views
0
Likes
Citation
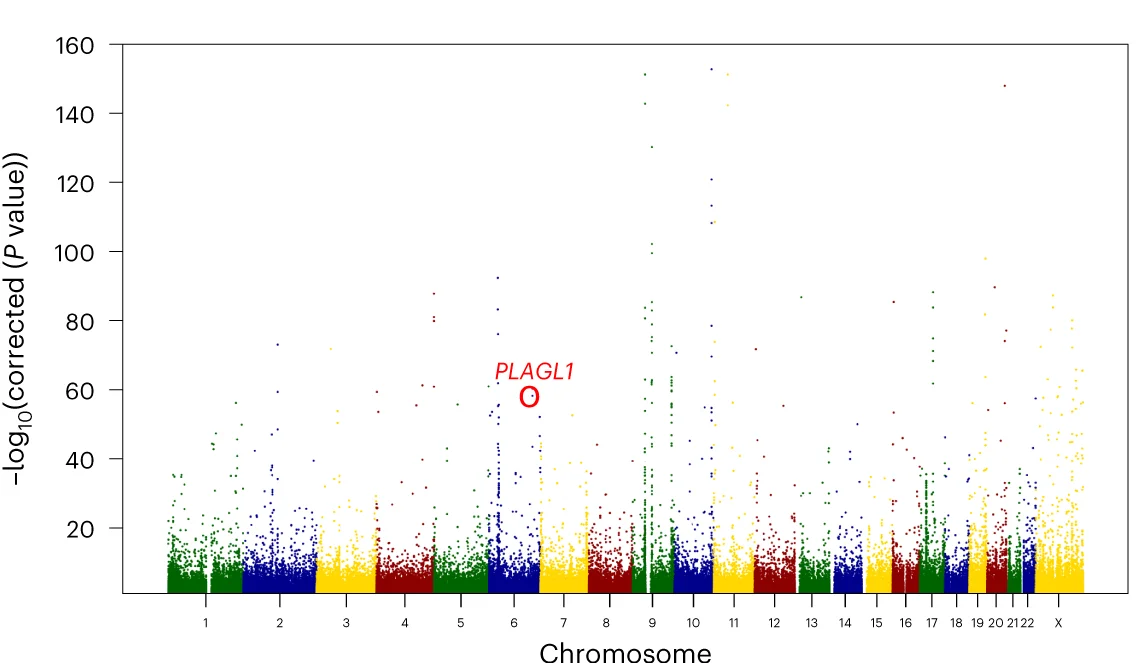
Manhattan plot of allele-specific methylation in NA12878. The x axis is chromosomal location and y axis is −log10(p) from Fisher’s exact test of association between genotype and in cis modC levels. PLAGL1 , a known imprinted gene, is highlighted in red.
Related Plots
Browse by Category
Popular Collections
Discover More Scientific Plots
Browse thousands of high-quality scientific visualizations from open-access research