Bubble Plot from Scientific Research

CC-BY
1
Views
0
Likes
Citation
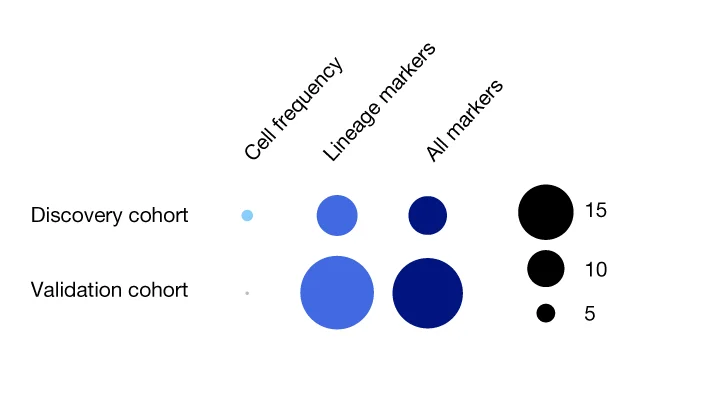
Accuracy of clinical progression prediction in patients with stage I LUAD; discovery cohort ( n = 286) and validation cohort ( n = 60; 120 cores) in the cell frequency, lineage and all markers models compared with baseline. The size of the bubble represents deviation from baseline, with blue and grey indicating an improvement or worsening in predictive performance, respectively.
#Bubble Plot#Clinical Progression#LUAD#Discovery Cohort#Validation Cohort#Cell Frequency#Lineage#Markers#Predictive Performance
Related Plots
Browse by Category
Popular Collections
Related Tags
Discover More Scientific Plots
Browse thousands of high-quality scientific visualizations from open-access research