Geo Map from Scientific Research

CC-BY
0
Views
0
Likes
Citation
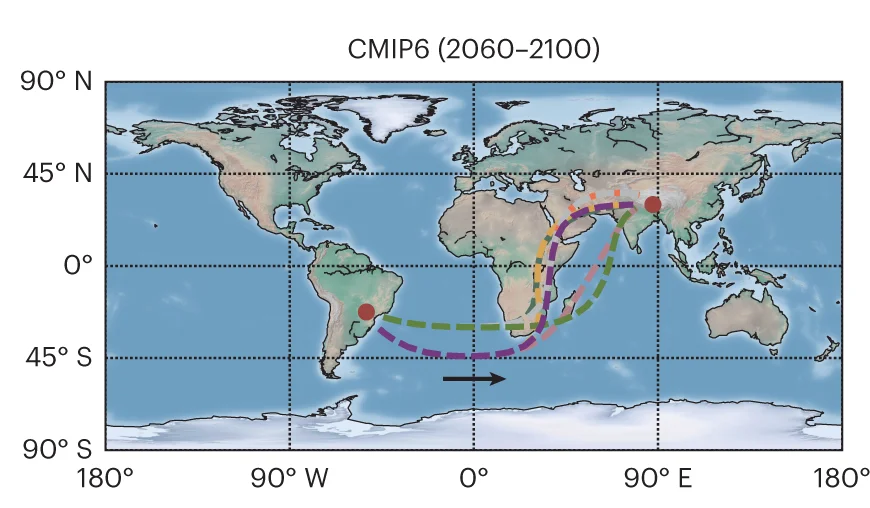
The large red and blue dots depict the starting and ending nodes and the small dots are the network nodes passed along the path. The black arrow indicates the propagation direction. The potential meteorological interpretation of this path is described by three parts, corresponding to the dashed lines with different colours.
Related Plots
Browse by Category
Popular Collections
Related Tags
Discover More Scientific Plots
Browse thousands of high-quality scientific visualizations from open-access research