Line Plot from Scientific Research

CC-BY
0
Views
0
Likes
Citation
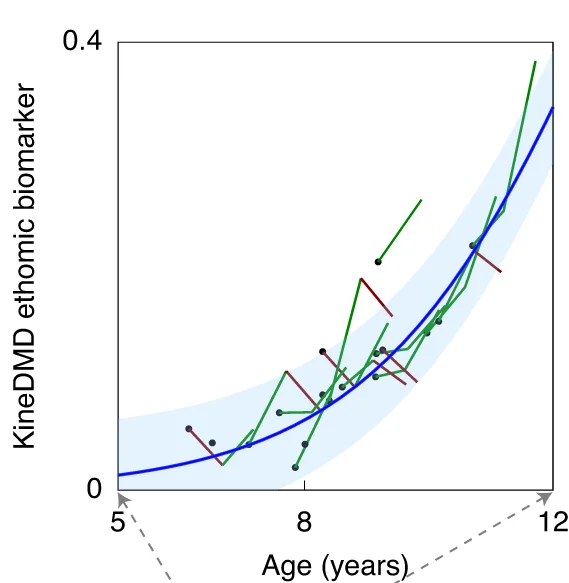
Plot of the KineDMD biomarker scale (solid blue line) along with the ethomic fingerprint-derived scores (lines flowing from the black dots) of the individuals with DMD from the KineDMD study as a function of age plotted on the x axis.
Related Plots
Browse by Category
Popular Collections
Related Tags
Discover More Scientific Plots
Browse thousands of high-quality scientific visualizations from open-access research