Raincloud Plot from Scientific Research

CC-BY
240
Views
2
Likes
Citation
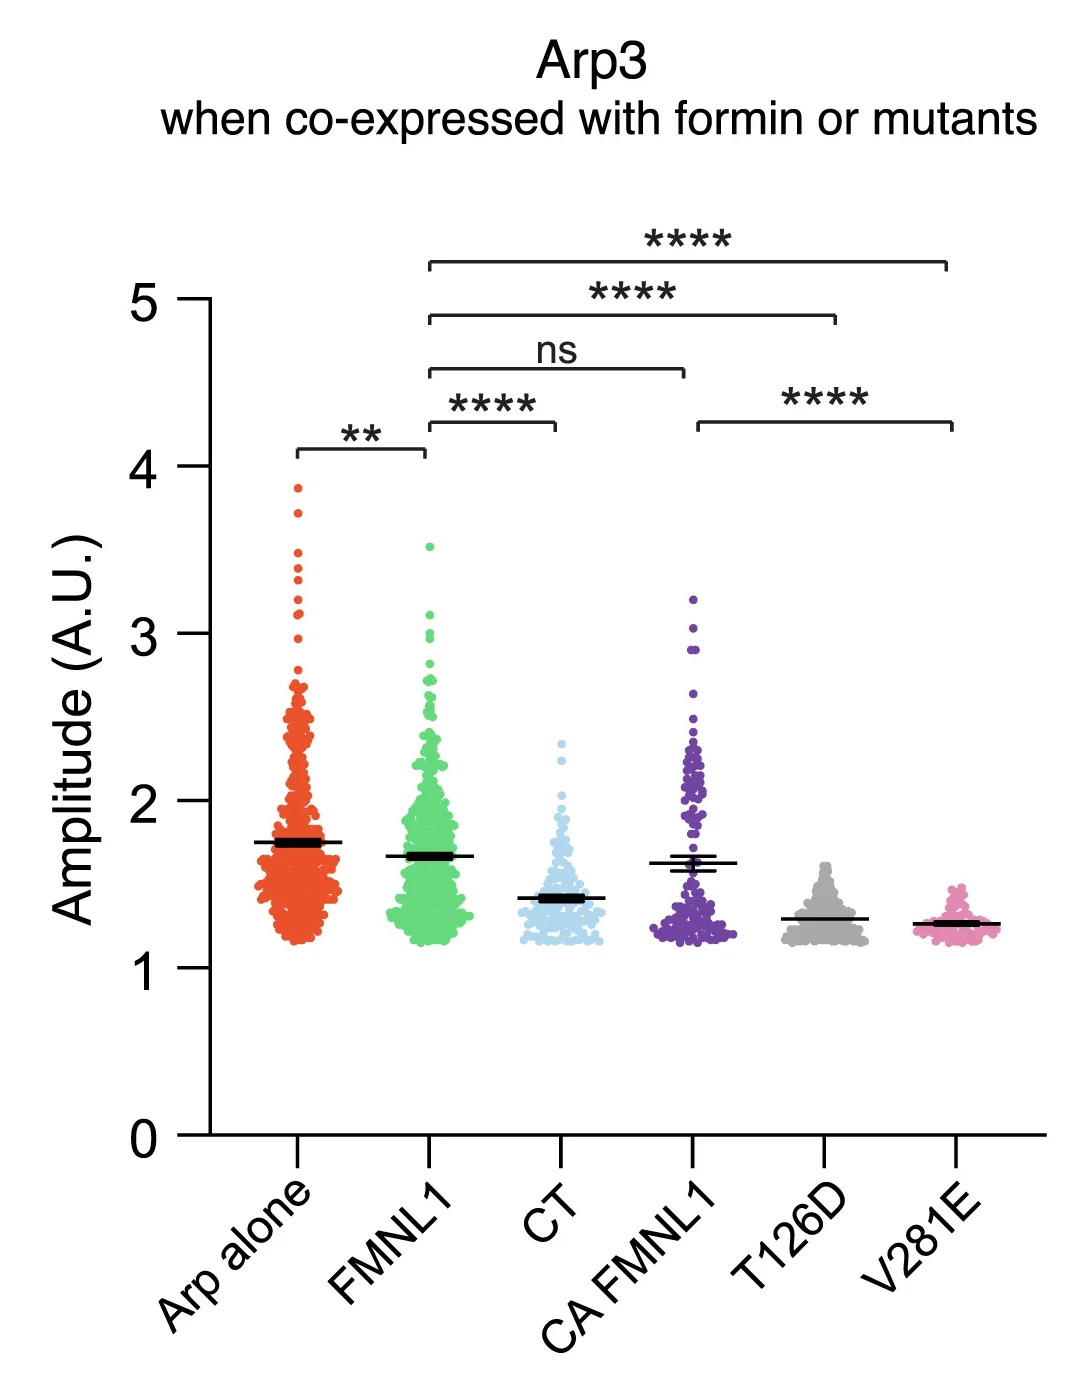
Quantifications for the average peak amplitudes of Arp3 when cell expresses mCherry-Arp3 or co-expresses mCherry-Arp3 with formin constructs. Sample sets for (J) and (K): single expression of mCherry-Arp3: 15 cells. Co-expression of mCherry-Arp3 with the following: FMNL1-GFP: 22 cells; GFP-FMNL1CT: 16 cells; GFP-CA-FMNL1: 9 cells; GFP-mini-FMNL1-T126D (inactive mutant): 16 cells; GFP-mini-FMNL1-V281E (active mutant): 14 cells. Statistical significance:**p< 0.0001; ns, not significant;**p< 0.012–0.0055, 1-way ANOVA, Dunnett’s multiple comparison test. Error bars represent mean ± SEM.
#Raincloud Plot#Quantifications#Average Peak Amplitudes#Arp3#mCherry-Arp3#Formin Constructs#FMNL1-GFP#GFP-FMNL1CT#GFP-CA-FMNL1#GFP-mini-FMNL1-T126D#Inactive Mutant#GFP-mini-FMNL1-V281E#Active Mutant
Related Plots
Browse by Category
Popular Collections
Related Tags
Discover More Scientific Plots
Browse thousands of high-quality scientific visualizations from open-access research