Line Plot from Scientific Research

CC-BY
101
Views
0
Likes
Citation
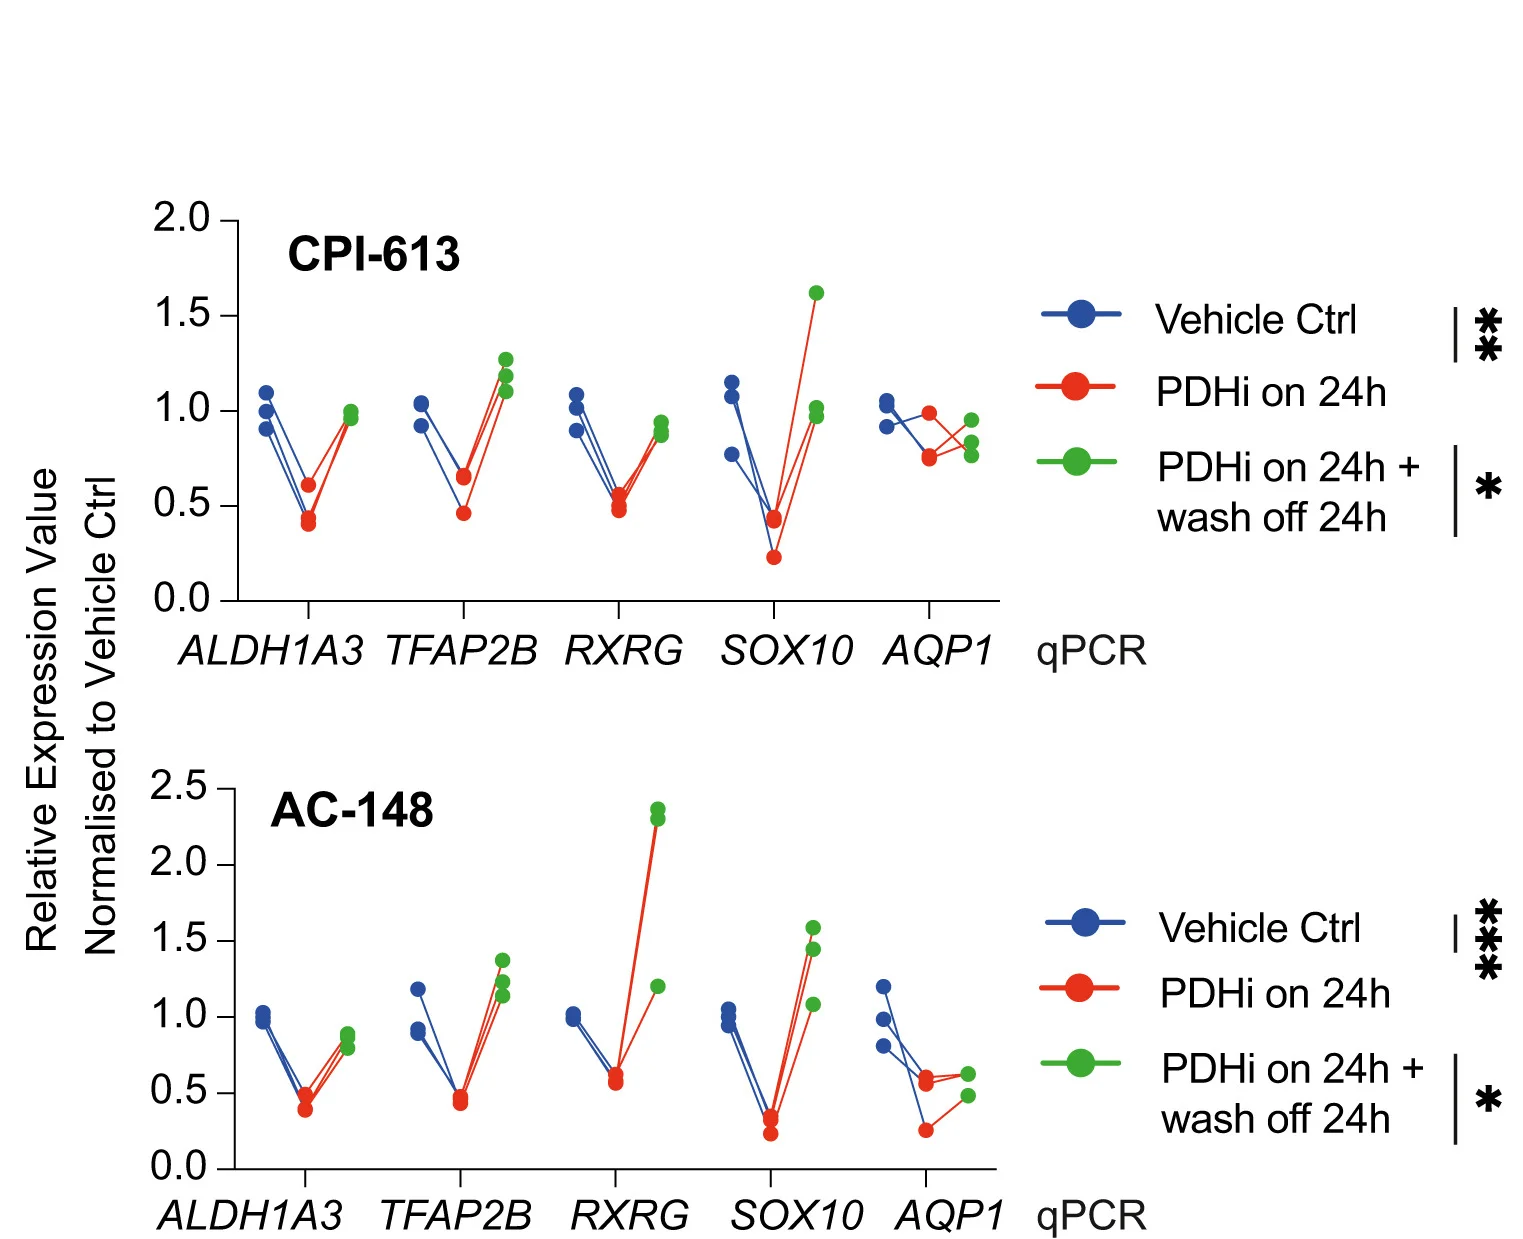
RT-qPCR-measured NCSC gene expression change in A375 and MPD002 in response to pyruvate dehydrogenase (PDH) activity change induced by PDH inhibitors (PDHis) CPI-613 (upper) and AC-148 (lower).*p< 0.05;**p< 0.01;***p< 0.001; one-way ANOVA with Sidaks correction.
#Line Plot#RT-qPCR#NCSC Gene Expression#A375 Cells#MPD002 Cells#Pyruvate Dehydrogenase#PDH Inhibitors#CPI-613#AC-148#One-way ANOVA
Related Plots
Browse by Category
Popular Collections
Related Tags
Discover More Scientific Plots
Browse thousands of high-quality scientific visualizations from open-access research