Scatter Plot from Scientific Research

CC-BY
17
Views
0
Likes
Citation
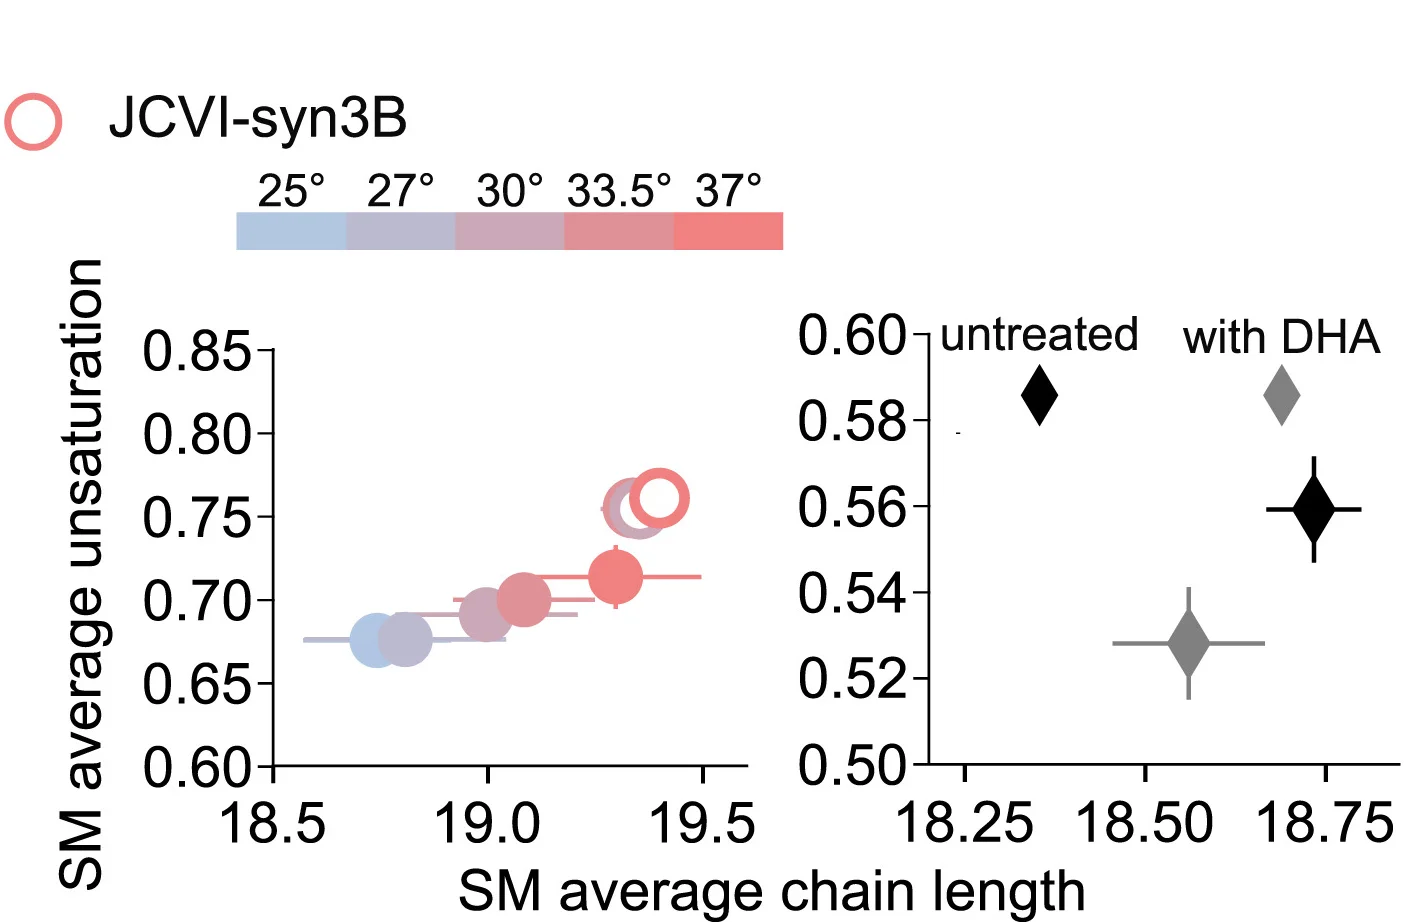
(Left) SM average chain length and unsaturation show the differences in SM features remodeling in M. mycoides (filled circles) and Syn3B (outlined circles). Mean ± standard deviation, n= 3. (Right) SM average features plotted against each other for RBL-derived GPMVs. n= 4 ± standard deviation, data adopted from Levental et al. n refers to the number of biological replicates in all samples.
#Scatter Plot#Error Bars#SM#Chain Length#Unsaturation#M. mycoides#Syn3B#RBL-derived GPMVs#Biological Replicates
Related Plots
Browse by Category
Popular Collections
Related Tags
Discover More Scientific Plots
Browse thousands of high-quality scientific visualizations from open-access research