Line Plot from Scientific Research

CC-BY
13
Views
0
Likes
Citation
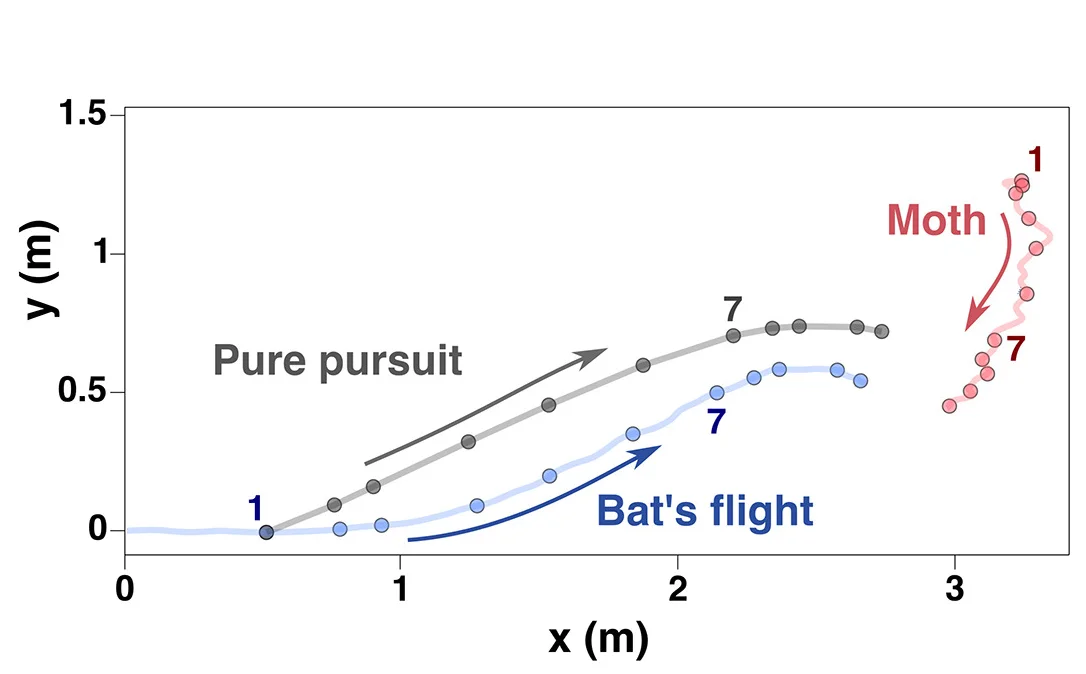
An example of the trajectories of original and simulated pure pursuit flights (top view). The circles indicate the animals location when the bat started to react to the update of target information 120 ms after each pulse emission. These trajectories indicated that the bat followed a clear, short-cut course. Top and side views of trajectories in all sessions are available in a repository (see data and code availability in STAR Methods).
Related Plots
Browse by Category
Popular Collections
Related Tags
Discover More Scientific Plots
Browse thousands of high-quality scientific visualizations from open-access research