Line Plot from Scientific Research

CC-BY
13
Views
0
Likes
Citation
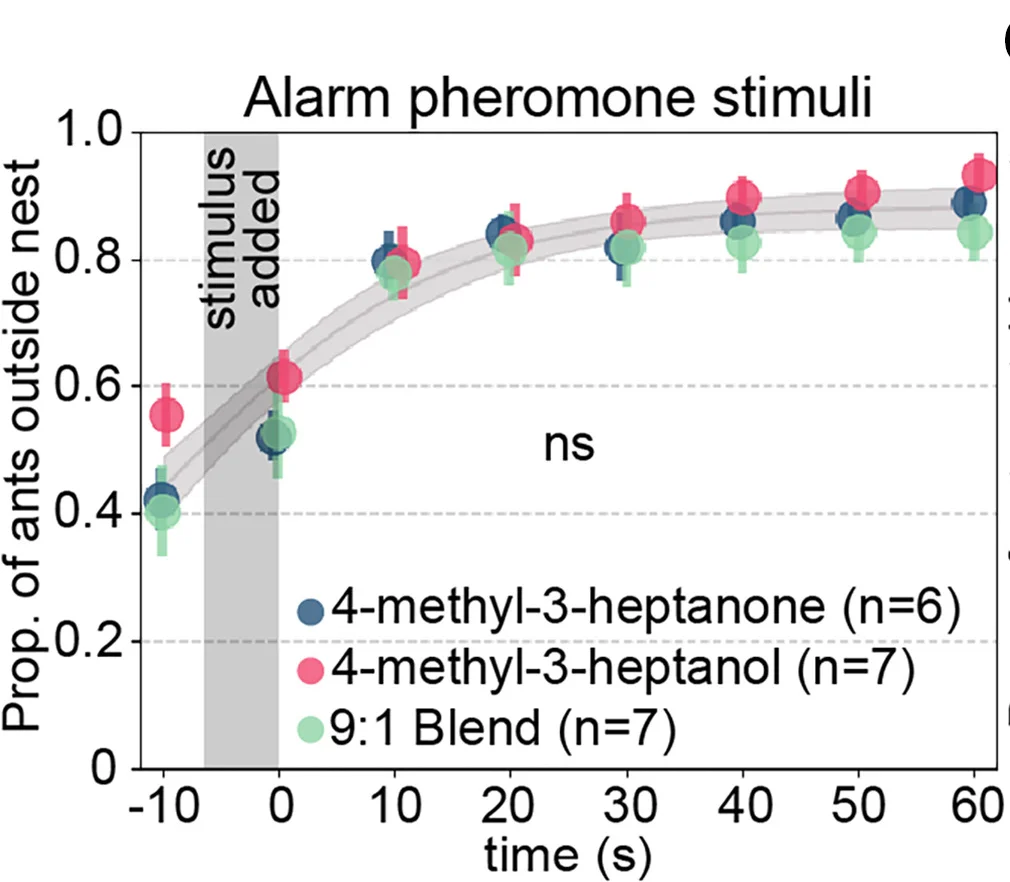
Data from young and old ants were pooled, and results from the three alarm pheromone stimuli were compared. Data points are slightly jittered. For (B) and (C), we used the extra sum-of-squares F test on same versus different curves, and vertical gray bars show the time window when the stimulus was added to the arena. SeeData S1for behavioral data. SeeTable S1for statistical analysis details. Data points show mean SEM. Ribbons show 95% CI of the curves. ns,p> 0.05.
Related Plots
Browse by Category
Popular Collections
Related Tags
Discover More Scientific Plots
Browse thousands of high-quality scientific visualizations from open-access research