Scatter Plot from Scientific Research

CC-BY
25
Views
0
Likes
Citation
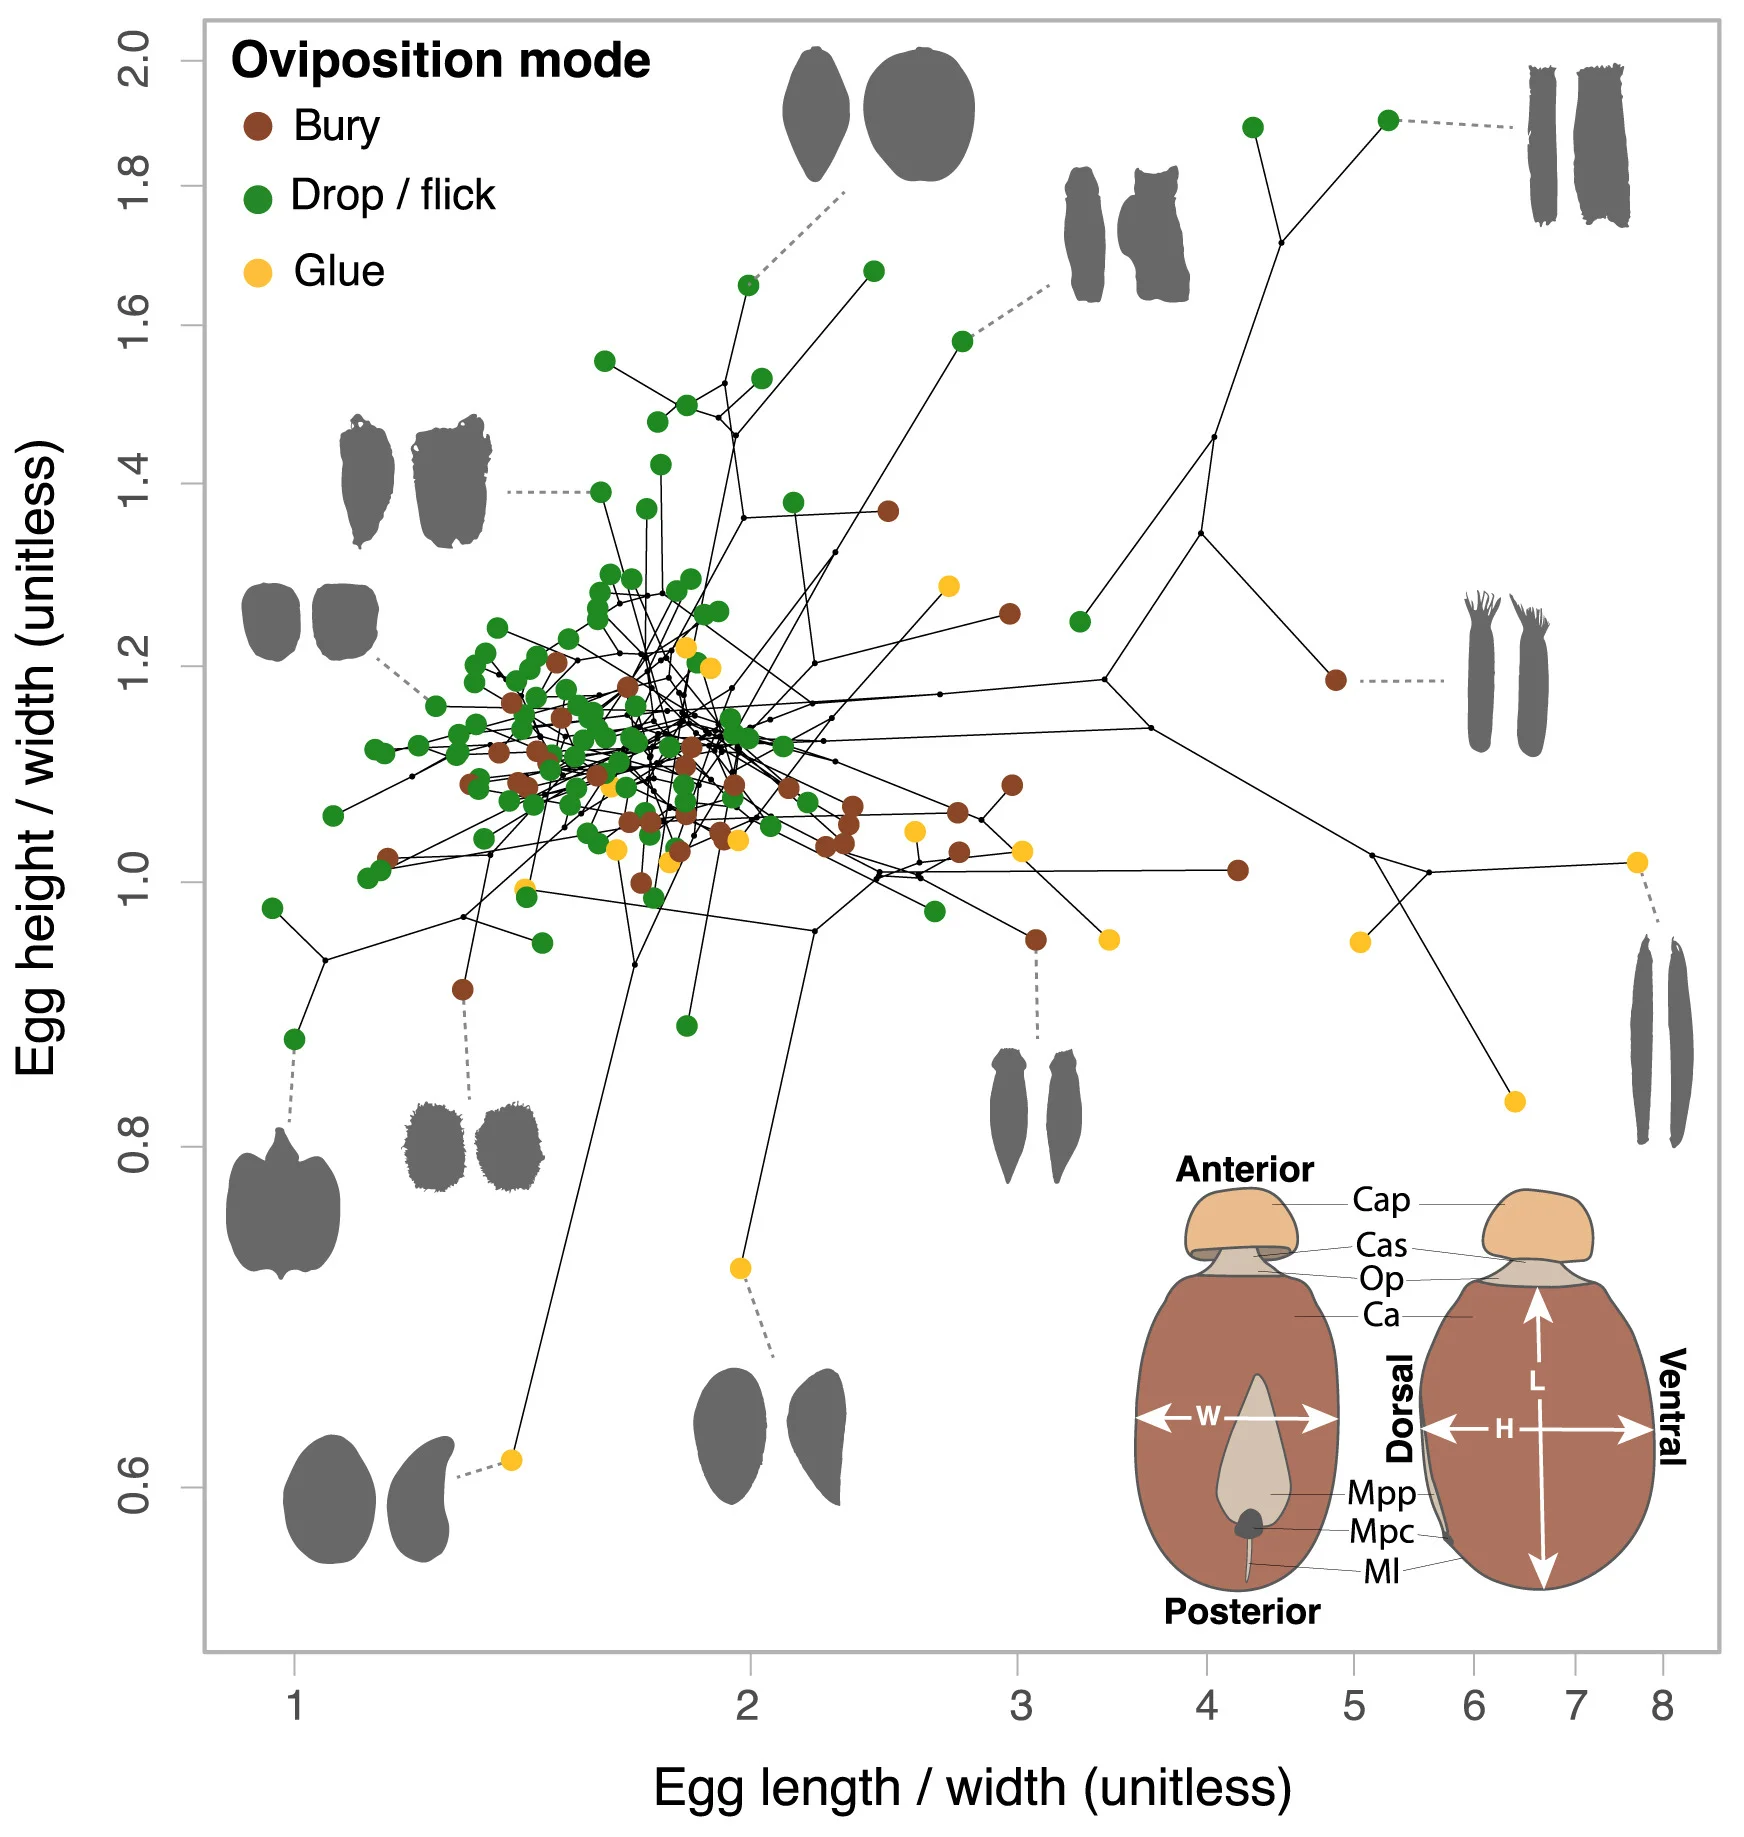
Phasmid egg morphospace showing egg length over width and height over width. These aspect ratios explain most of the variation in egg shape (Figure S1). Black lines between points represent underlying phylogenetic relationships. Egg silhouettes are represented in dorsal (left) and side (right) view. Bottom right inset shows the drawing of a phasmid egg (Eurycnema osiris). Cap, capitulum; Cas, capitulum stalk; Op, operculum; Ca, egg capsule; Mpp, micropylar plate; Mpc, micropylar cup; Ml, median line; L, egg length; W, egg width; H, egg height. Colors correspond to oviposition mode.
#Scatter Plot#Network#Illustration#Phasmid Egg Morphospace#Egg Length#Egg Width#Egg Height#Phylogenetic Relationships#Egg Silhouettes#Oviposition Mode
Related Plots
Browse by Category
Popular Collections
Related Tags
Discover More Scientific Plots
Browse thousands of high-quality scientific visualizations from open-access research