Scatter Plot from Scientific Research

CC-BY
10
Views
0
Likes
Citation
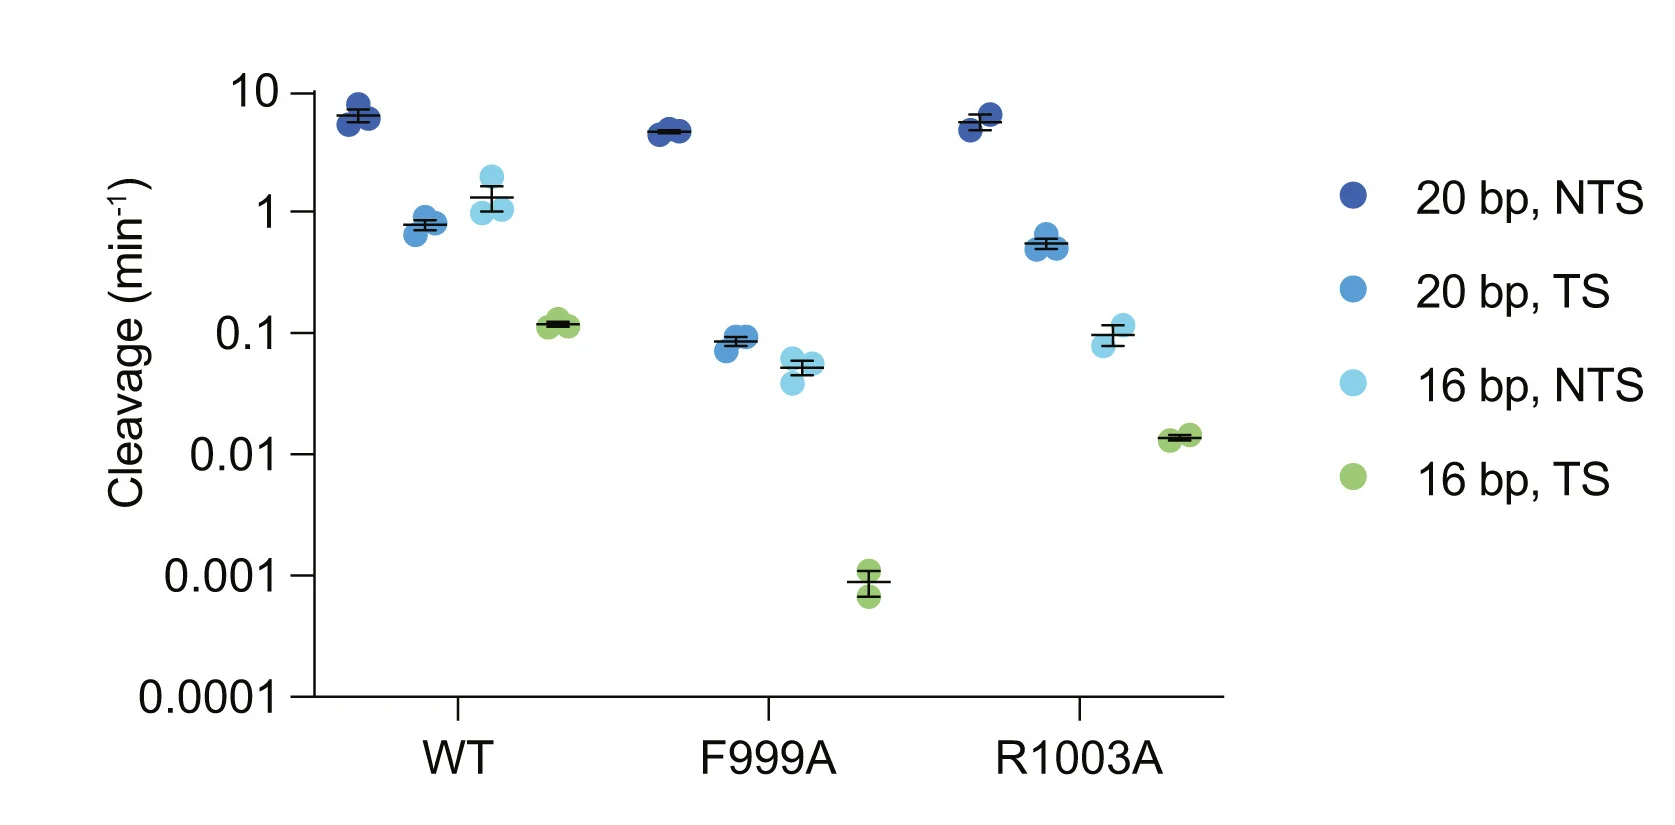
NTS and TS cleavage of the 20- and 16-bp substrates measured for WT and RuvC lid mutants. Colored circles represent individual replicates. Black lines define the mean standard error of the mean (SEM).
Related Plots
Browse by Category
Popular Collections
Related Tags
Discover More Scientific Plots
Browse thousands of high-quality scientific visualizations from open-access research