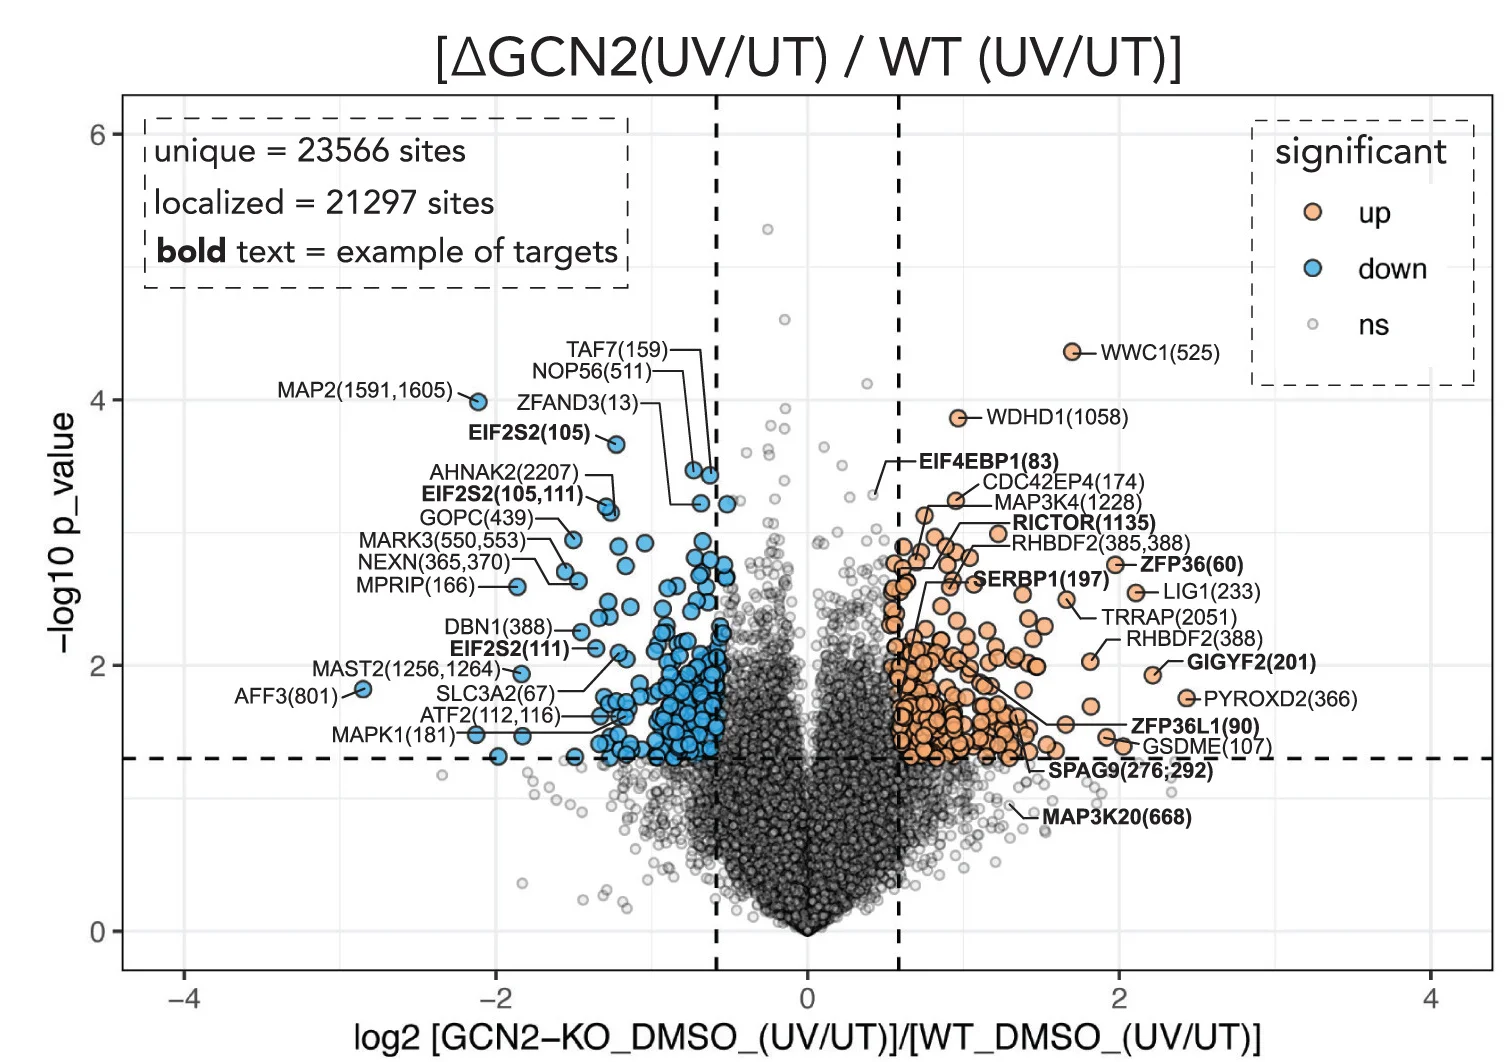
Volcano Plot from Scientific Research

CC-BY
29
Views
0
Likes
Citation
As in (A) and (B) but for MCF10a GCN2 compared to WT (E) (seeFigure S9A;Table S2). Statistical tests as in (A) and (B). SeeFigures S9andS6G;Tables S2andS3; andData S1.
#Volcano Plot#Scatter Plot#Volcano Plots#Phosphosite Abundance#UV-C#MCF10a GCN2 Cells#WT Cells#Phosphopeptides#Welch’s t-test
Related Plots
Browse by Category
Popular Collections
Related Tags
Discover More Scientific Plots
Browse thousands of high-quality scientific visualizations from open-access research