Heatmap from Scientific Research

CC-BY
3
Views
0
Likes
Citation
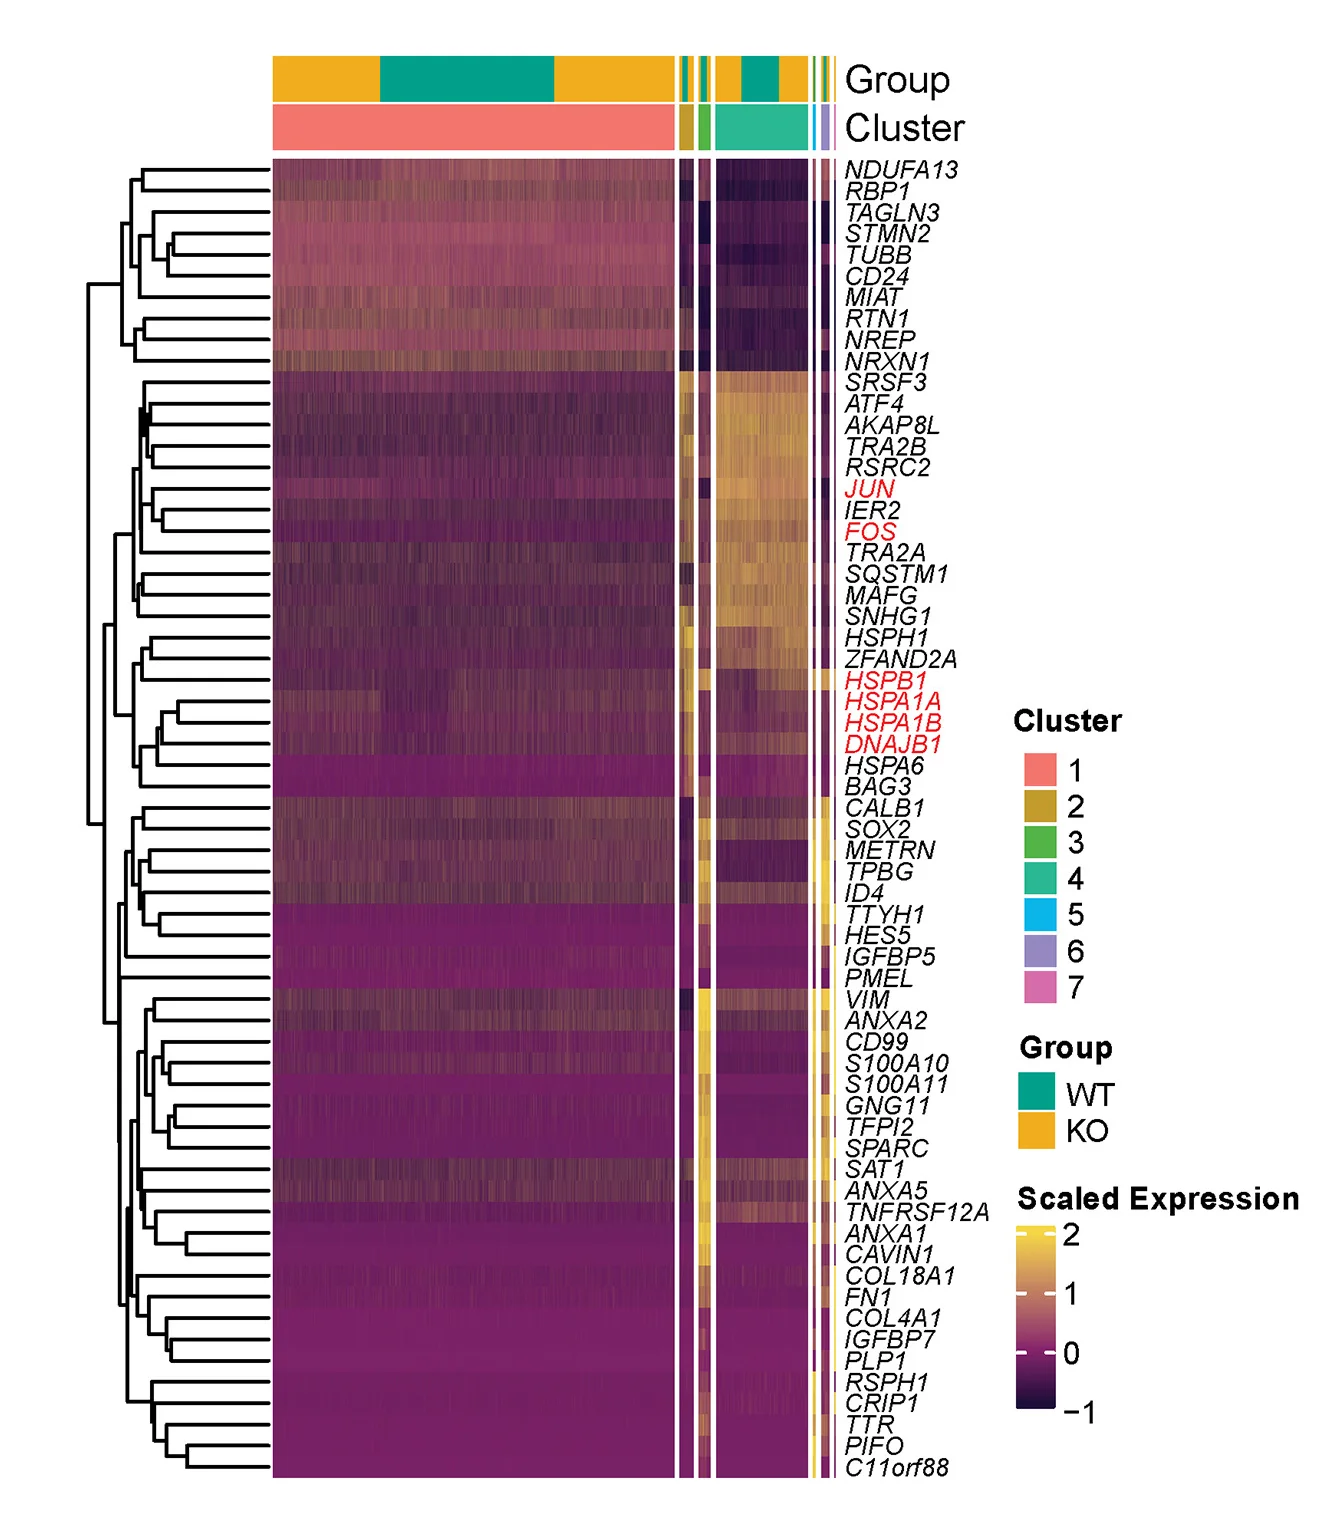
Heatmap of top enriched gene set in each cluster of p53 WT vs. p53 KO cells at 24 h post transplantation, demonstrating increased cell death-related genes in clusters 3, 5, and 6 and survival-related genes in clusters 2 and 4. Red font indicates survival-related genes.
Related Plots
Browse by Category
Popular Collections
Related Tags
Discover More Scientific Plots
Browse thousands of high-quality scientific visualizations from open-access research