Network from Scientific Research

CC-BY
1
Views
0
Likes
Citation
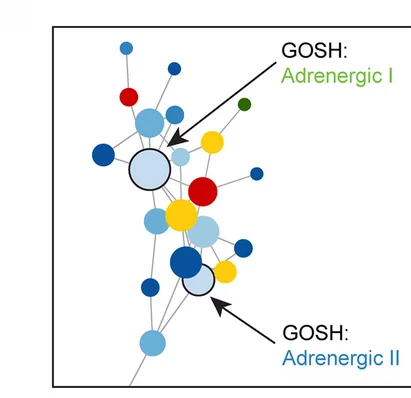
Inset showing a detailed view of region b from panel a . This region has connected adrenergic I and adrenergic II programs. In this inset, nodes have been colored by dataset, rather than community (as in panel a ).
#Network#Adrenergic I#Adrenergic II#Gene Expression Programs#Neuroblastoma#Single-Cell RNA-Seq#Human#PDX#GEMM#Cell Lines#acNMF
Related Plots
Browse by Category
Popular Collections
Discover More Scientific Plots
Browse thousands of high-quality scientific visualizations from open-access research