Line Plot from Scientific Research

CC-BY
1
Views
0
Likes
Citation
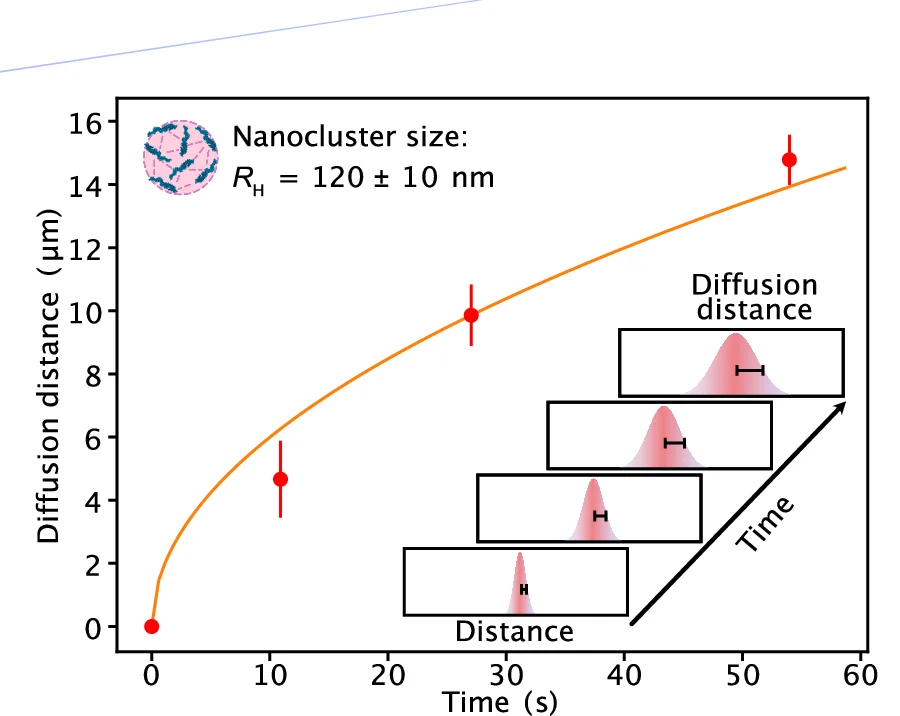
Plot of mean diffusion distance versus time of travel within the channel. The inset graphically shows how diffusion distances were determined. The diffusion distance corresponds to the half of the full-width half maximum (FWHM) of the Gaussian distributions at each measurement point. The width at timepoint zero was used for normalization. Data points (mean) are from three repeats; error bars indicate standard deviations. The orange line shows the fit according to Eq. 1 . The extracted average R H of TDP-43 nanoclusters is given as an inset (mean ± standard deviation).
#Line Plot#Scatter Plot#Error Bars#Density Plot#Diffusion Distance#Time of Travel#Channel#Gaussian Distribution#TDP-43 Nanoclusters
Related Plots
Browse by Category
Popular Collections
Related Tags
Discover More Scientific Plots
Browse thousands of high-quality scientific visualizations from open-access research