Forest Plot from Scientific Research

CC-BY
2
Views
0
Likes
Citation
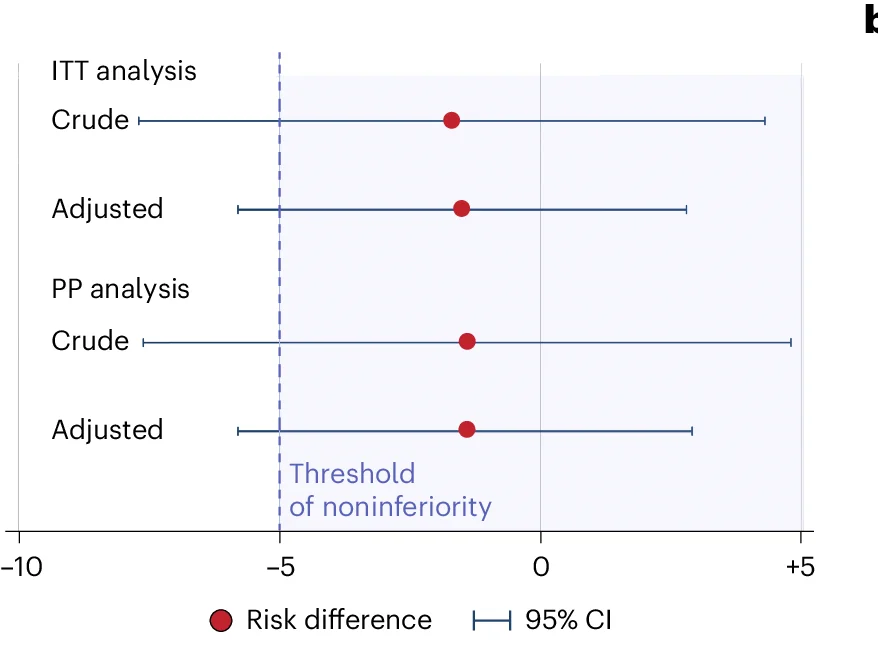
Crude and adjusted risk difference (red circle represents mean risk difference and blue error bars represent 95% CI of the risk difference) in clinical pregnancy rates between the iDAScore and the control groups (a negative risk difference indicates lower clinical pregnancy rate in the iDAScore group) per intention-to-treat (ITT) analysis (n = 1,066) and PP analysis (n = 1,002).
Related Plots
Browse by Category
Popular Collections
Related Tags
Discover More Scientific Plots
Browse thousands of high-quality scientific visualizations from open-access research