Scatter Plot from Scientific Research

CC-BY
0
Views
0
Likes
Citation
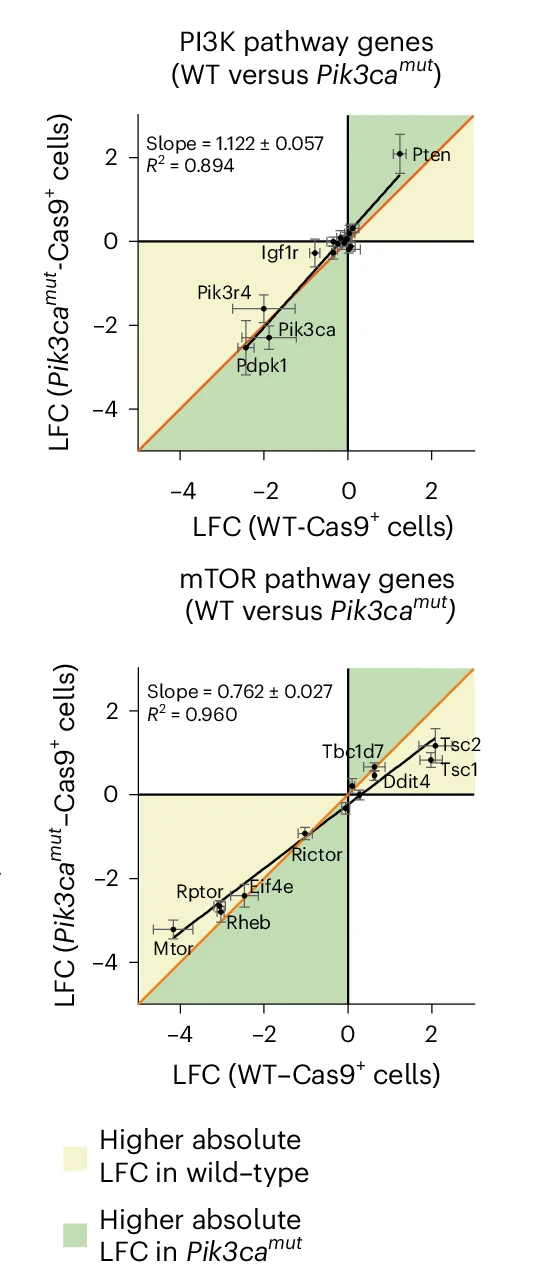
Plots showing the correlation between average log 2 (fold change) of gRNA targeting indicated genes in the following cells and conditions: Pik3ca H1047R/wt cells ( y axis) versus WT cells ( x axis) in control (CTL) condition (the panels indicate gene sets of PI3K pathway genes (top) and mTOR pathway genes (bottom)). In c – e , the yellow and green areas of each graph indicate the higher absolute log 2 (fold change) in x -axis or y -axis condition, respectively. Linear regression (black) with slope and coefficient of determination R 2 . Identity line, orange. The error bars indicate the s.d. of n = 2–3 screen replicates.
#Scatter Plot#Regression Plot#Error Bars#gRNA#PI3K Pathway Genes#mTOR Pathway Genes#Linear Regression
Related Plots
Browse by Category
Popular Collections
Related Tags
Discover More Scientific Plots
Browse thousands of high-quality scientific visualizations from open-access research