Bubble Plot from Scientific Research

CC-BY
1
Views
0
Likes
Citation
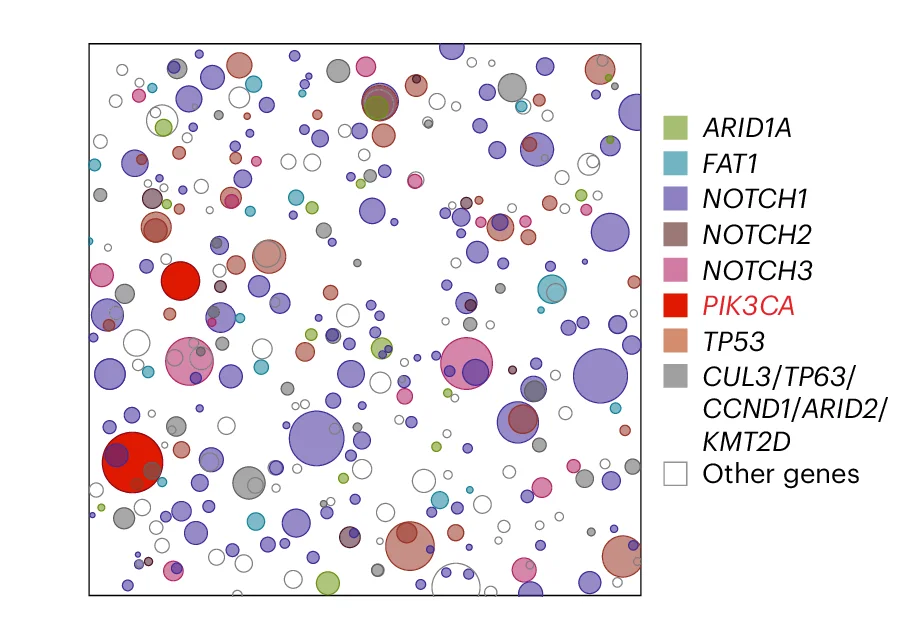
Schematic representation of mutant clones in an average 1 cm 2 of normal esophageal epithelium from a 48-51-year-old male donor from ref. 1 . To generate the figure, a number of samples from the donor are randomly selected and the mutant clones detected are represented as circles and randomly distributed in space.
Related Plots
Browse by Category
Popular Collections
Related Tags
Discover More Scientific Plots
Browse thousands of high-quality scientific visualizations from open-access research