Line Plot from Scientific Research

CC-BY
2
Views
0
Likes
Citation
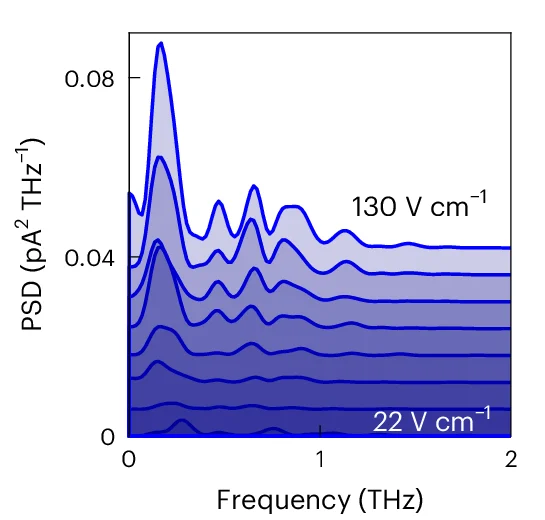
PSD of the time traces in a . The curves are shifted vertically, and areas under them are shaded for clarity.
Related Plots
Browse by Category
Popular Collections
Related Tags
Discover More Scientific Plots
Browse thousands of high-quality scientific visualizations from open-access research