QQ Plot from Scientific Research

CC-BY
1
Views
0
Likes
Citation
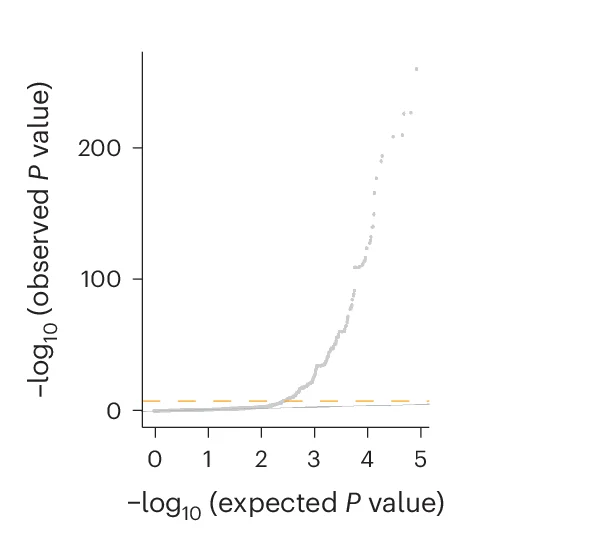
Representative quantile–quantile plot (whole-blood JTI model) displaying the observed and expected distribution of −log 10 (METSIM P values) for gene–metabolite entries with metabolic genes that pass the threshold P < 0.05 in the CLSA. Expected distribution was calculated based on all considered entries. The gray line is y = x ; the orange dashed line is the Bonferroni threshold based on gene–metabolite associations with all genes. P values (uncorrected) are from the TWAS METSIM analysis.
#QQ Plot#Quantile-Quantile Plot#JTI Model#METSIM#P Values#Gene-Metabolite Entries#Metabolic Genes#CLSA#TWAS METSIM Analysis
Related Plots
Browse by Category
Popular Collections
Related Tags
Discover More Scientific Plots
Browse thousands of high-quality scientific visualizations from open-access research