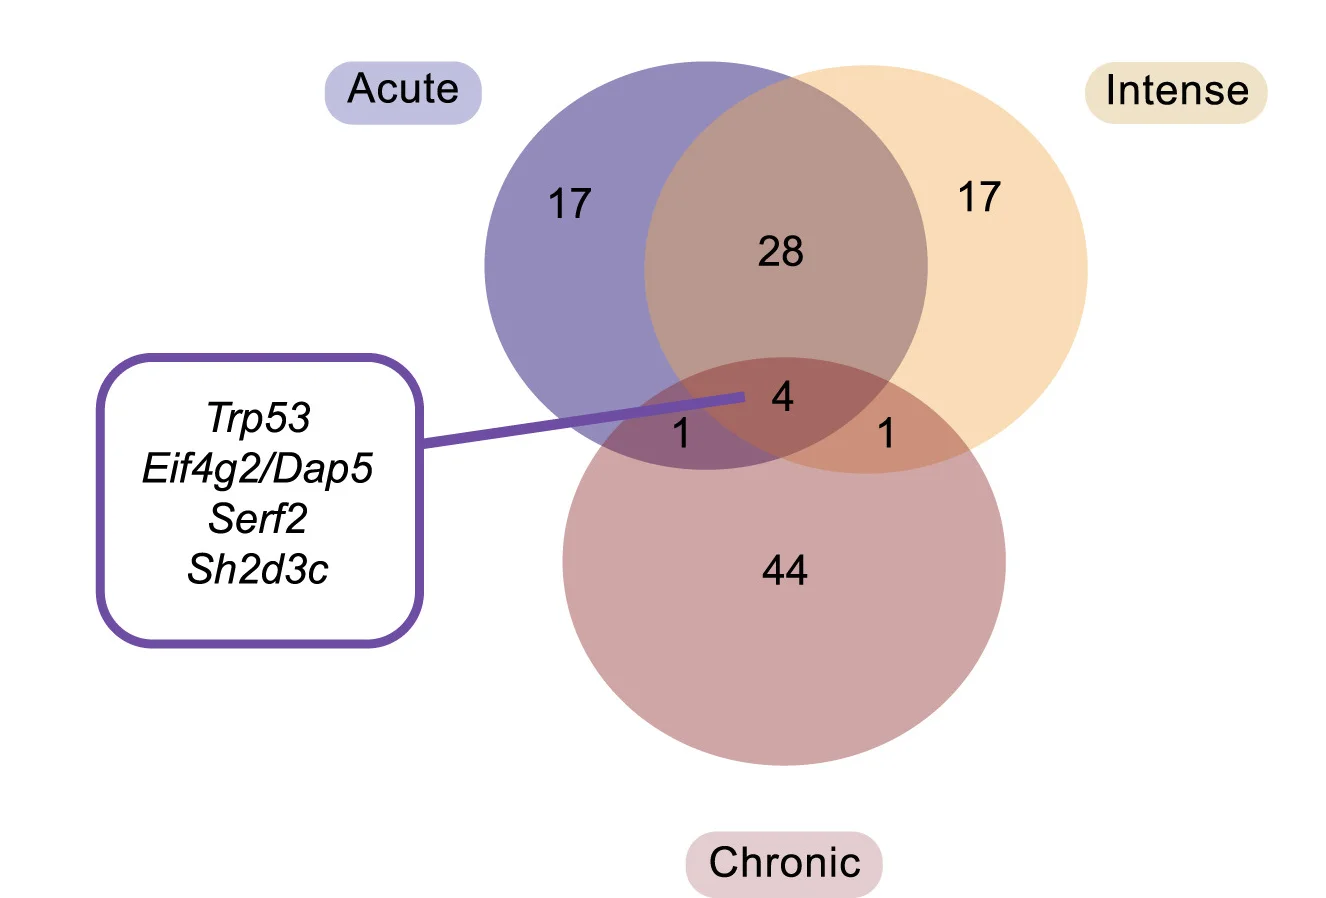
Venn Diagram from Scientific Research

CC-BY
4
Views
0
Likes
Citation
Numbers of overlapping genes from top 50 hits of each screen. Genes are listed by average effect size (Table S1).
Related Plots
Browse by Category
Popular Collections
Related Tags
Discover More Scientific Plots
Browse thousands of high-quality scientific visualizations from open-access research