Manhattan Plot from Scientific Research

CC-BY
1
Views
0
Likes
Citation
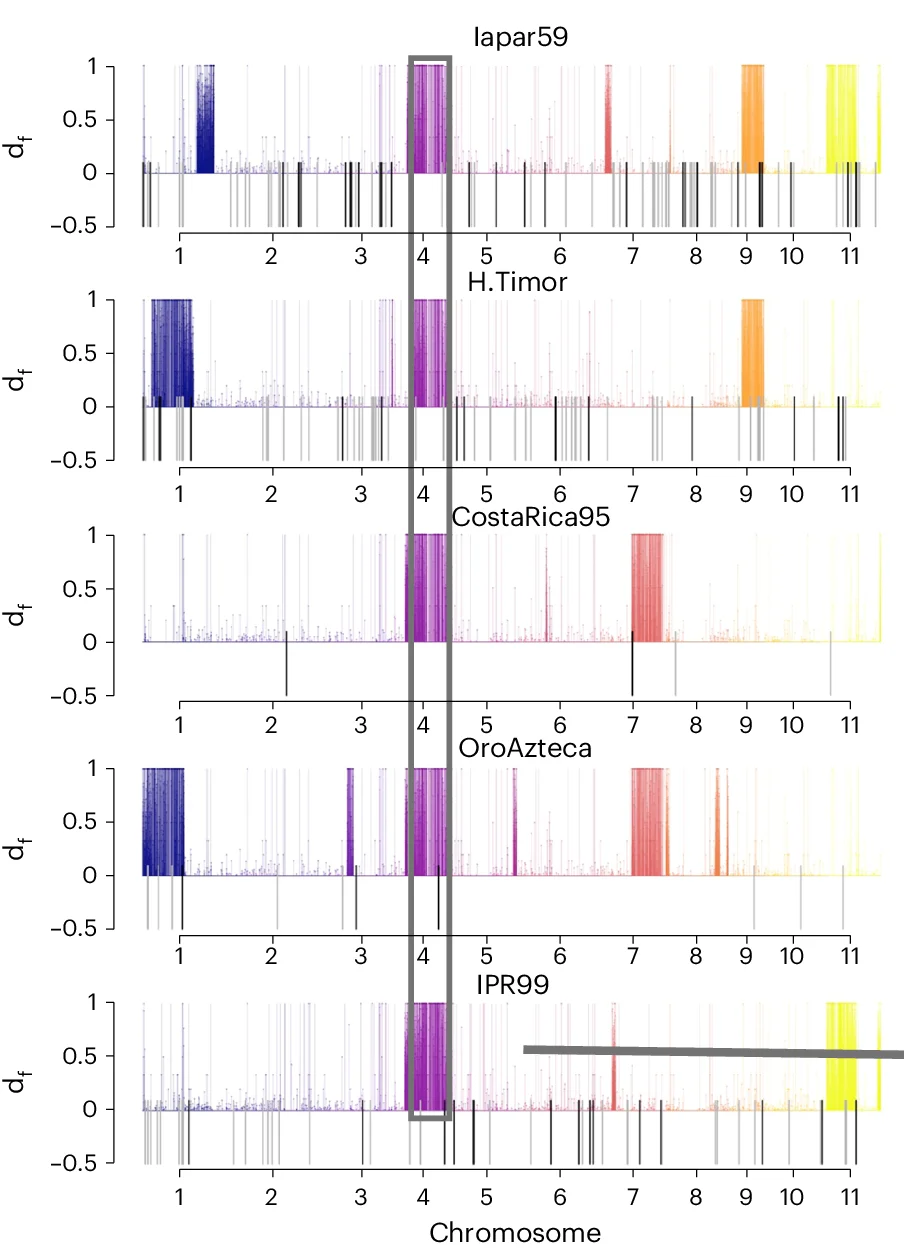
Introgression d f statistic estimated for different Timor hybrid derivatives. Colored lines above the axis mark regions of significant introgression in the line under inspection, and are colored by chromosome. The shared introgressed region on chromosome 4 is colored in purple and boxed. TIPs are represented as lines below the x axis and exhibit overlap with introgressed regions.
Related Plots
Browse by Category
Popular Collections
Related Tags
Discover More Scientific Plots
Browse thousands of high-quality scientific visualizations from open-access research