Scatter Plot from Scientific Research

CC-BY
3
Views
0
Likes
Citation
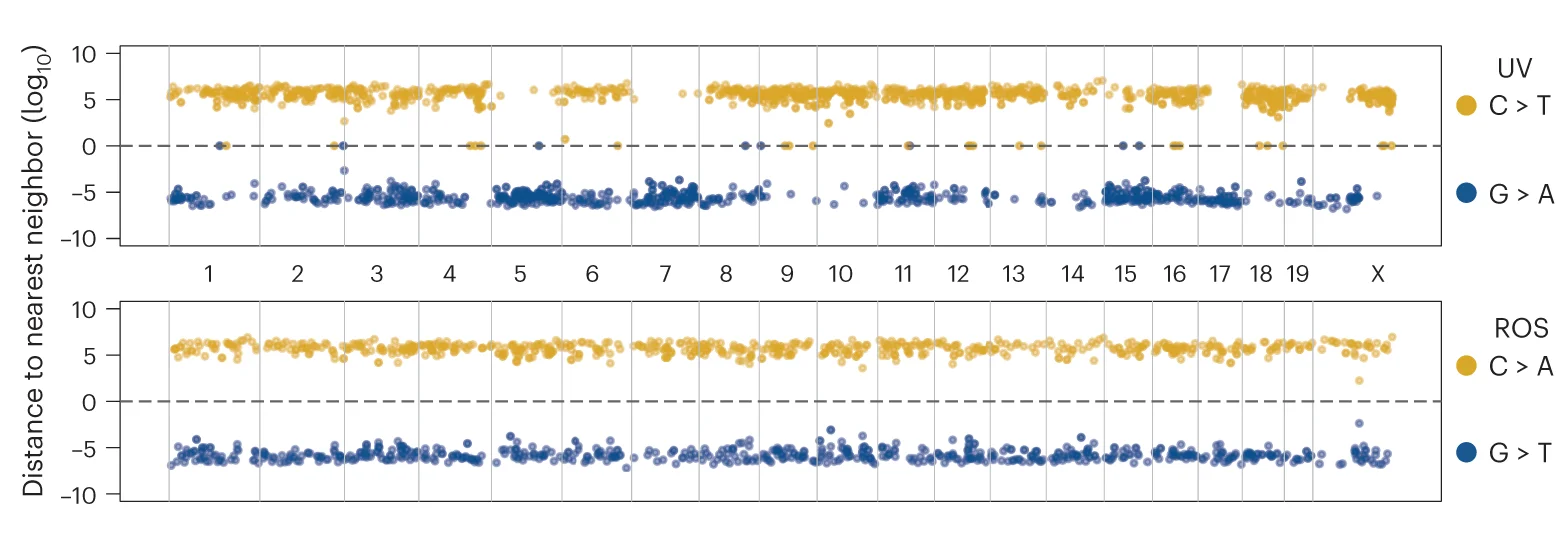
Example of lesion segregation pattern due to UV induced mutations (top) across all chromosomes of a single mitotic sister, and lack of phasing from ROS induced mutagenesis (bottom) in the same sister. Reference cytosine mutations are shown as yellow dots, whereas reference guanine residues are in blue. The y axis represents log2(distance to nearest neighbor), with G mutation distances converted to negative values to distinguish them from C residues. Chromosomal boundaries are denoted by black vertical dashed lines and chromosomes noted between the tracks. Horizontal dashed line represents a distance of 0.
#Scatter Plot#Manhattan Plot#Lesion Segregation#UV Induced Mutations#ROS Induced Mutagenesis#Cytosine Mutations#Guanine Residues#Chromosomes
Related Plots
Browse by Category
Popular Collections
Discover More Scientific Plots
Browse thousands of high-quality scientific visualizations from open-access research