Venn Diagram from Scientific Research

CC-BY
1
Views
0
Likes
Citation
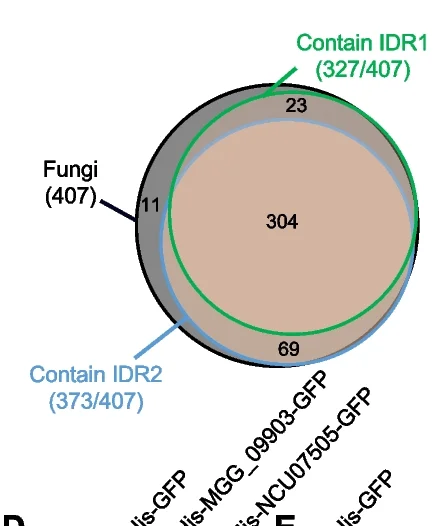
Venn diagram of IDR distribution in BP1 orthologs from fungi (407 total, black). Among the fungal BP1 orthologs, the number of proteins containing IDR1 (327, green) and IDR2 (373, blue) is shown.
Related Plots
Browse by Category
Popular Collections
Related Tags
Discover More Scientific Plots
Browse thousands of high-quality scientific visualizations from open-access research