Chord from Scientific Research

CC-BY
1
Views
0
Likes
Citation
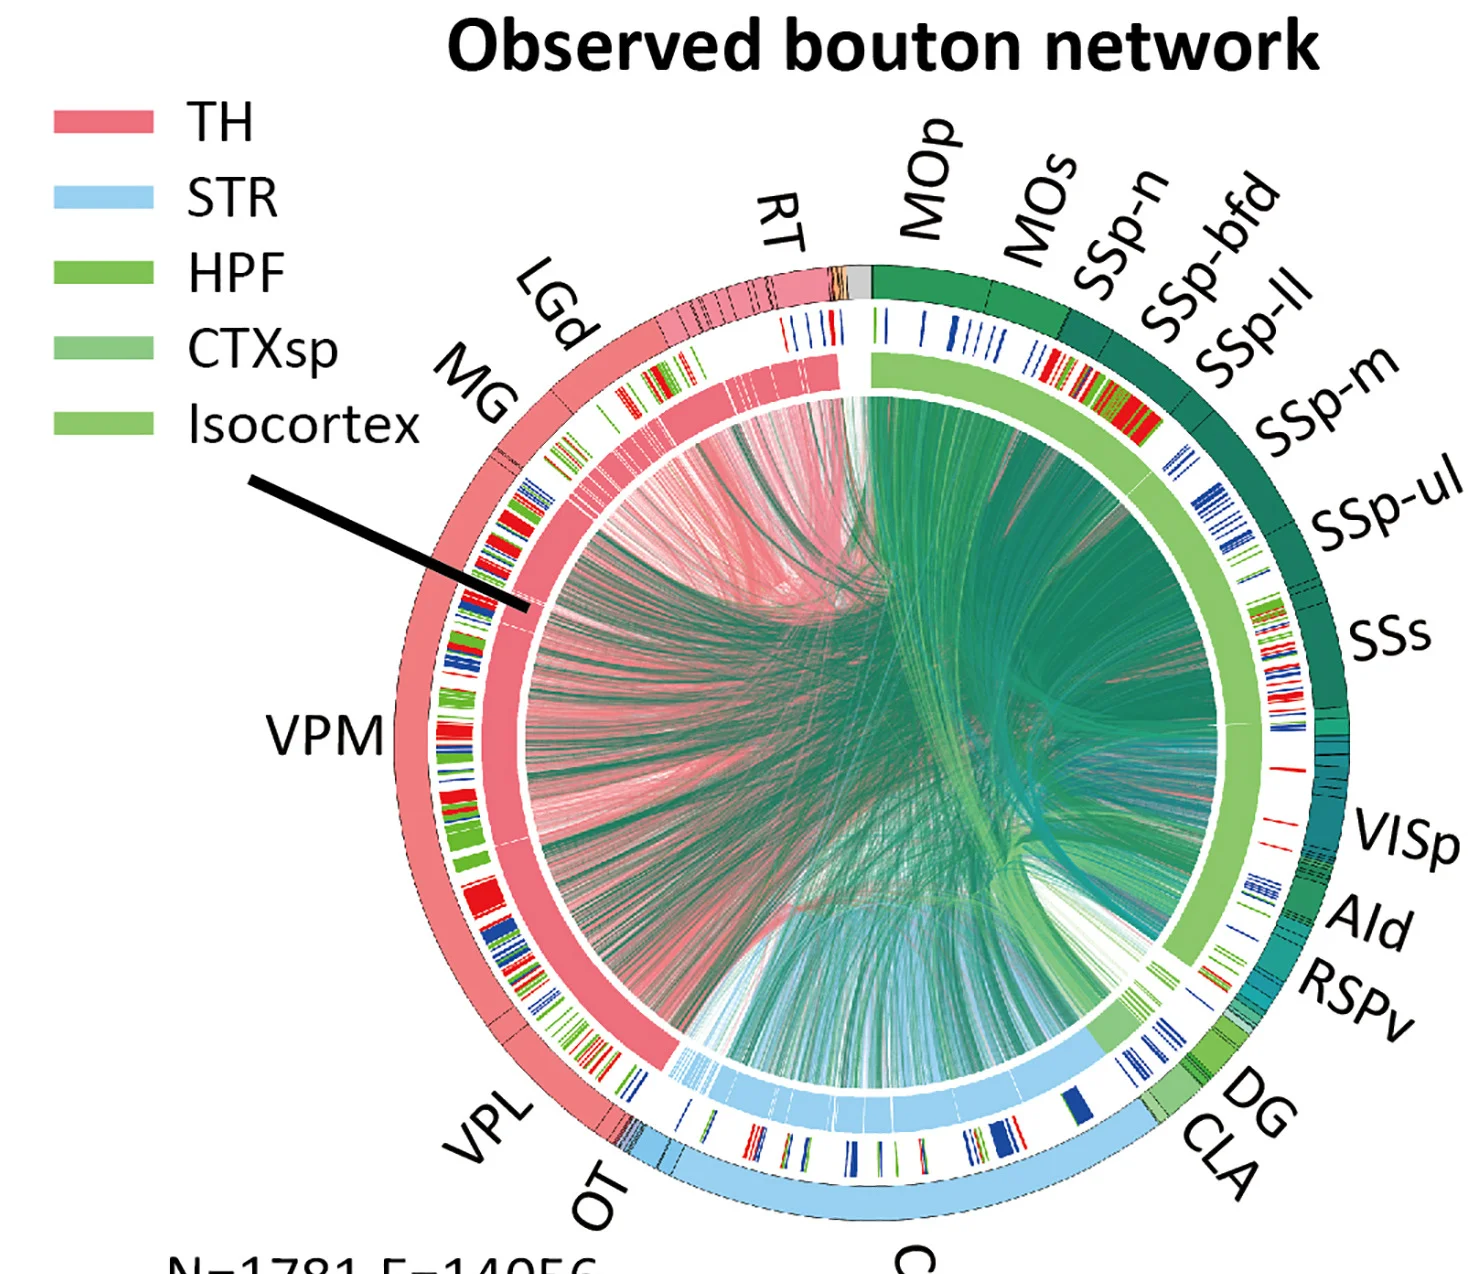
Circular plot visualization of the single-cell networks constructed based on observed (left) and uniform (right) bouton data. We assigned the colors in the outer circle by the soma location of each neuron in the network. The middle circle indicates the largest three communities obtained using the Leiden algorithm, and the inner circle indicates the broad brain regions TH, STR, hippocampal formation (HPF), cortical subplate (CTXsp), and isocortex. The lines crossing the center of the circle indicate potential connections between individual neurons. We colored them according to the soma location of the pre-synaptic neuron.
#Chord#Network#Single-Cell Networks#Bouton Data#Neuron Soma Location#Brain Regions#Neuronal Connections
Related Plots
Browse by Category
Popular Collections
Related Tags
Discover More Scientific Plots
Browse thousands of high-quality scientific visualizations from open-access research