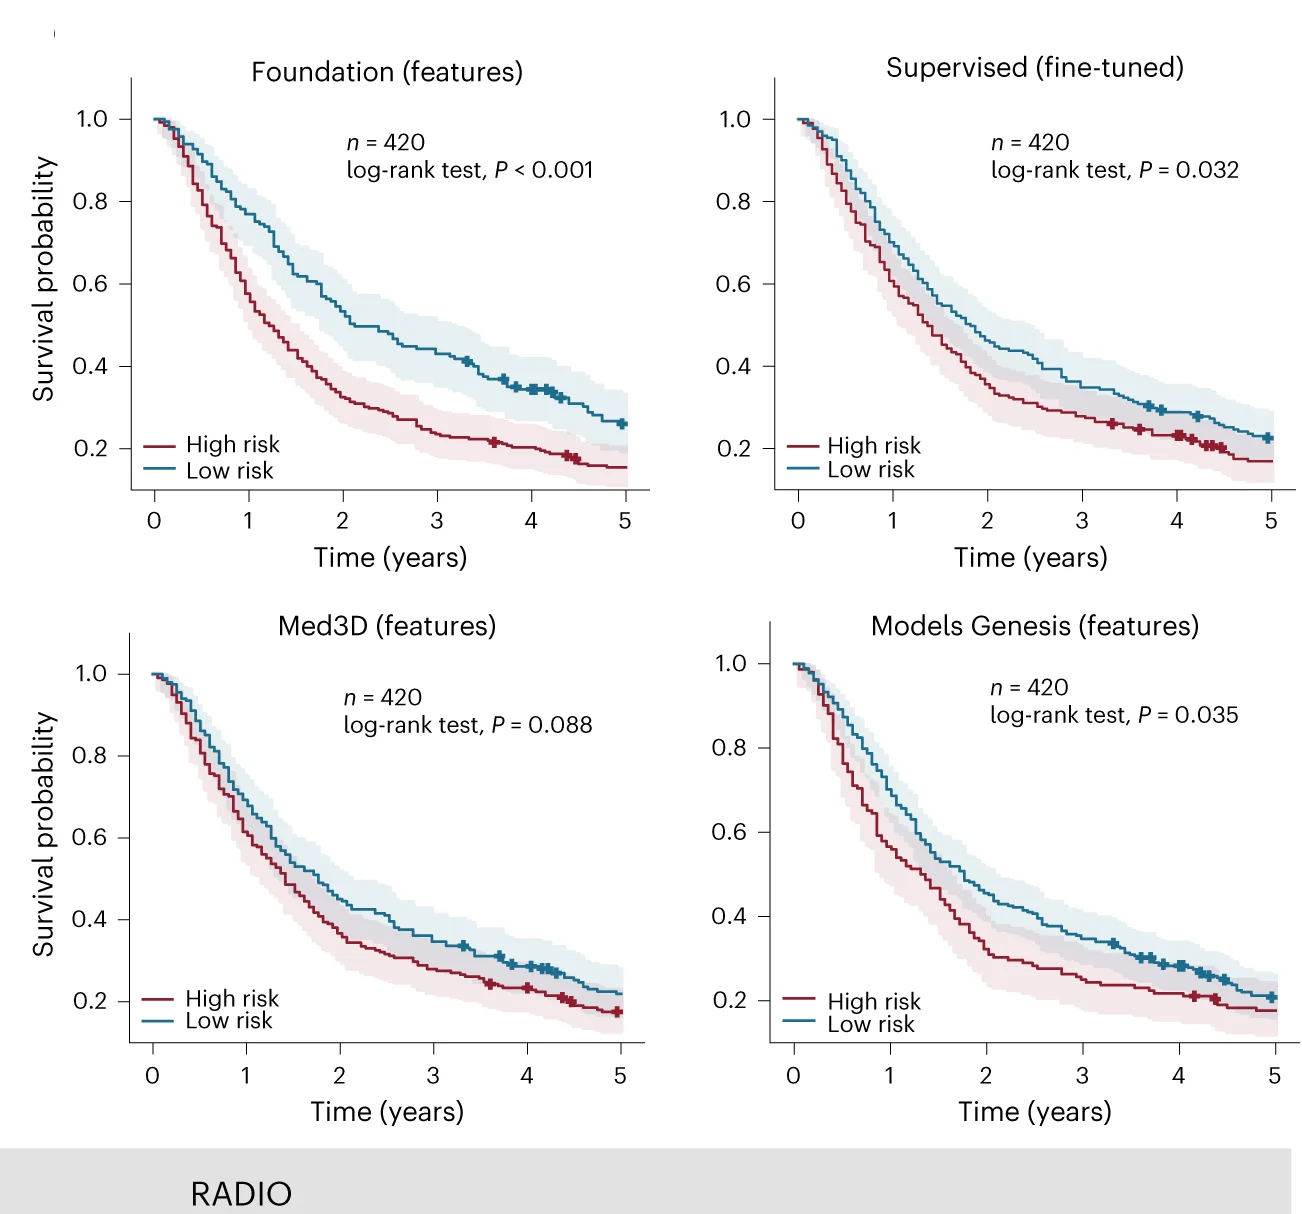
Survival Curve from Scientific Research

CC-BY
8
Views
0
Likes
Citation
KaplanMeier curves for groups stratified by model predictions from the best performing among implementation approaches are shown for LUNG1. To ensure a fair comparison, we calculated the threshold to split the risk groups on the HarvardRT tuning set for each implementation. The 95% CI of the estimates is shown by error bands. The measure of centre for the error bands is the KaplanMeier estimate of the survival function. KaplanMeier curves for all approaches can be found in Extended Data Fig. 6.
#Survival Curve#Error Bars#Kaplan-Meier Curves#Model Predictions#LUNG1#HarvardRT Tuning Set#Survival Function
Related Plots
Browse by Category
Popular Collections
Related Tags
Discover More Scientific Plots
Browse thousands of high-quality scientific visualizations from open-access research