Survival Curve from Scientific Research

CC-BY
1
Views
0
Likes
Citation
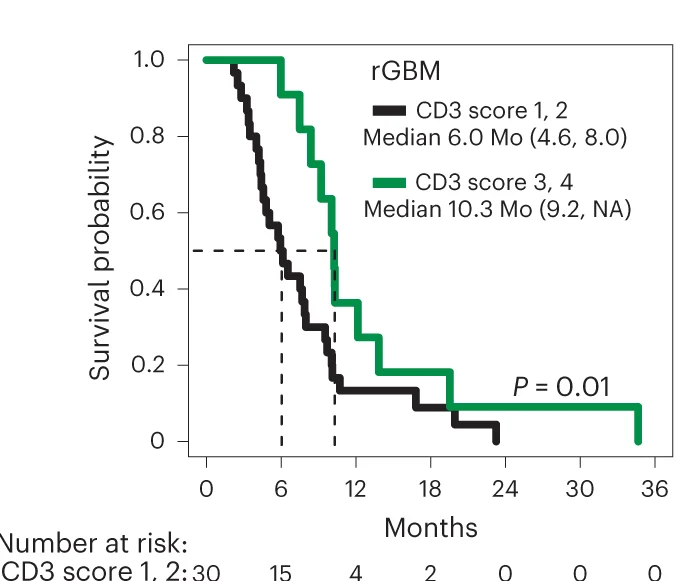
Survival comparison of all evaluable rGBM patients with either negative/low (1, 2) or intermediate/high (3, 4) tumor CD3 IHC scores. Dashed lines depict medians in months (Mo). Median survival times with 95% CIs in parentheses are also indicated; NA means infinity. P values comparing survival distribution of each group using the two-sided peto-peto test are depicted.
Related Plots
Browse by Category
Popular Collections
Discover More Scientific Plots
Browse thousands of high-quality scientific visualizations from open-access research