Sankey from Scientific Research

Citation
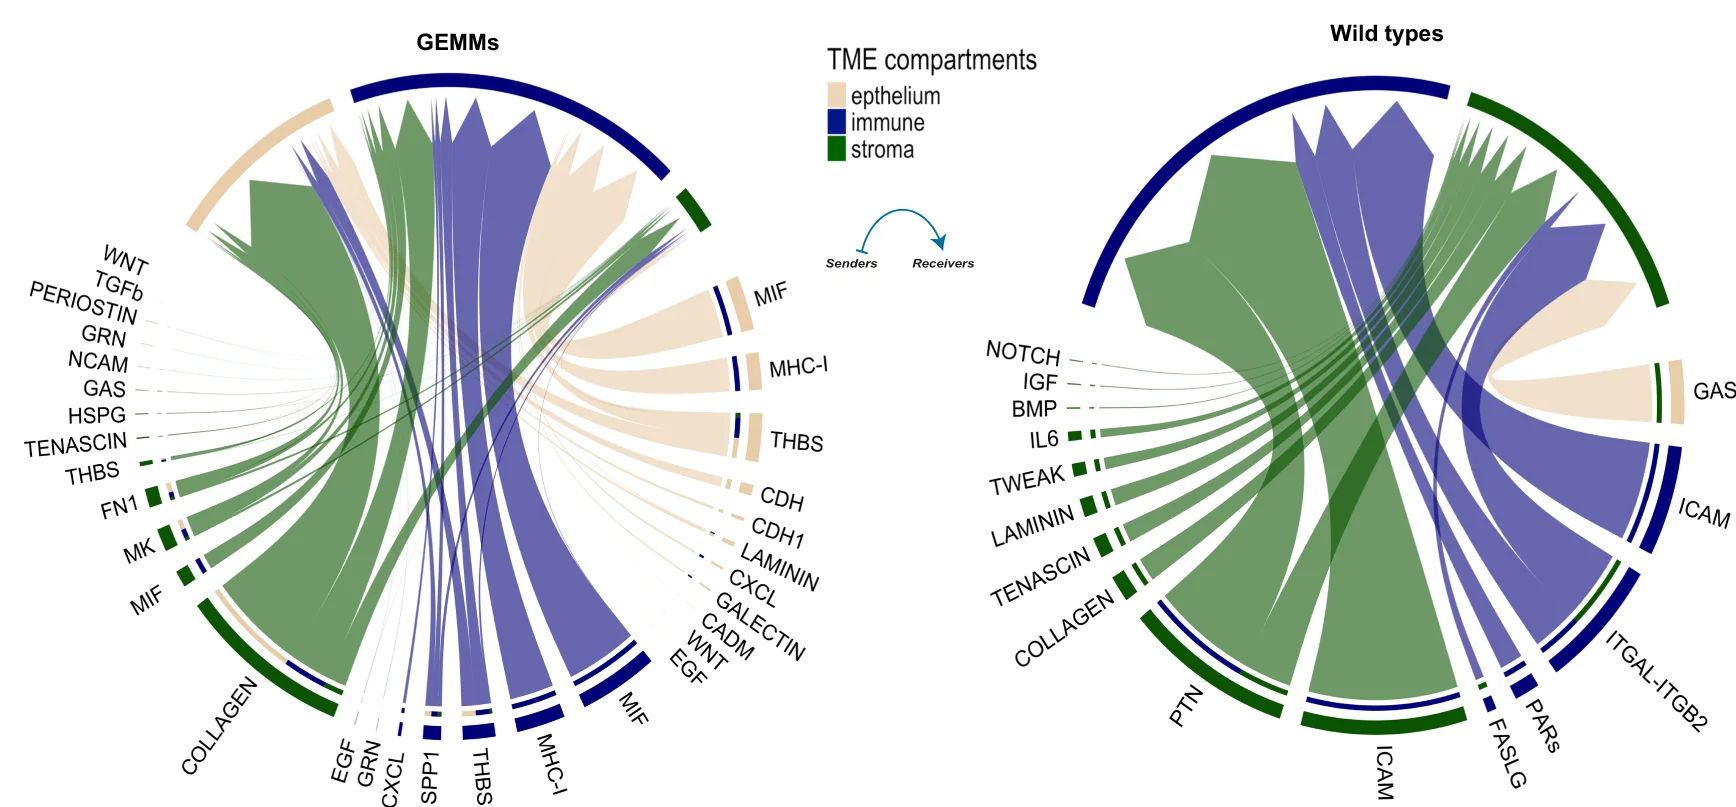
Chord diagrams displaying the significant signaling networks between the stroma, epithelium, and immune compartments in mutants (left) and wild types (right). Each sector represents a distinct compartment, and the size of the inner bars represents the signal strength received by their targets. Up- and down-regulated signaling L-R pairs were identified based on differential gene expression analysis between mutants and wild types, with a log-fold change (logFC) of 0.2 set as a threshold. Communication probabilities for the L-R interactions were calculated after adjusting for the size of cell populations, and then aggregated on the signaling pathway-level. UMAP: Uniform Manifold Approximation and Projection.
Related Plots
Browse by Category
Popular Collections
Related Tags
Discover More Scientific Plots
Browse thousands of high-quality scientific visualizations from open-access research