Scatter Plot from Scientific Research

CC-BY
285
Views
3
Likes
Citation
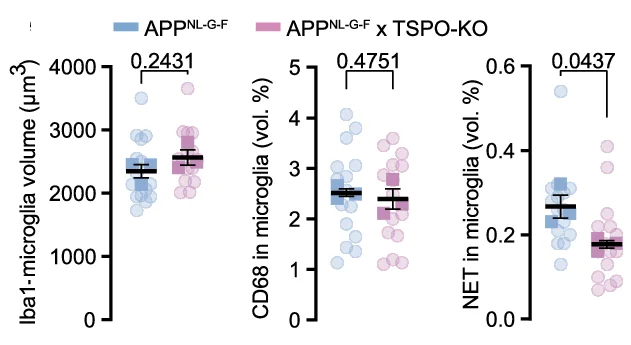
Analysis of NET volume, Iba1 volume and CD68 volume. App NL-G-F x TSPO-KO microglia contain less NET + signal than App NL-G-F microglia. ( n = 3 C57BL/6 J vs. n = 3 App NL-G-F , each 5 pictures).
Related Plots
Browse by Category
Popular Collections
Related Tags
Discover More Scientific Plots
Browse thousands of high-quality scientific visualizations from open-access research