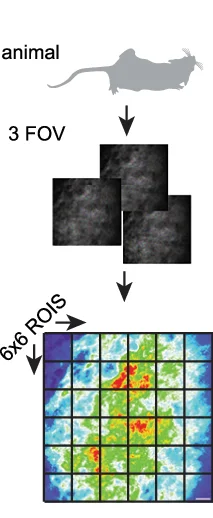
Workflow from Scientific Research

CC-BY
59
Views
0
Likes
Citation
Illustration of the analysis of 2 P in vivo imaging data. Graphic modified from Claudi, F. (2020). Mouse Top Detailed. Zenodo. https://doi.org/10.5281/zenodo.3925997 .
Related Plots
Browse by Category
Popular Collections
Related Tags
Discover More Scientific Plots
Browse thousands of high-quality scientific visualizations from open-access research