Bar Plot from Scientific Research

CC-BY
64
Views
1
Likes
Citation
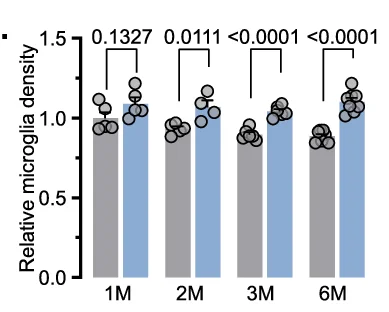
Quantification of relative microglia density and (C57BL/6 J at 1,2,3,6 months: n = 5,5,6,7 and App NL-G-F at 1,2,3,6 months: n = 5,4,6,8)
#Bar Plot#Error Bars#Clustered#Scatter Plot#Relative Microglia Density#C57BL/6 J Mice#App NL-G-F Mice#Statistical Analysis
Related Plots
Browse by Category
Popular Collections
Related Tags
Discover More Scientific Plots
Browse thousands of high-quality scientific visualizations from open-access research