Bar Plot from Scientific Research

CC-BY
33
Views
0
Likes
Citation
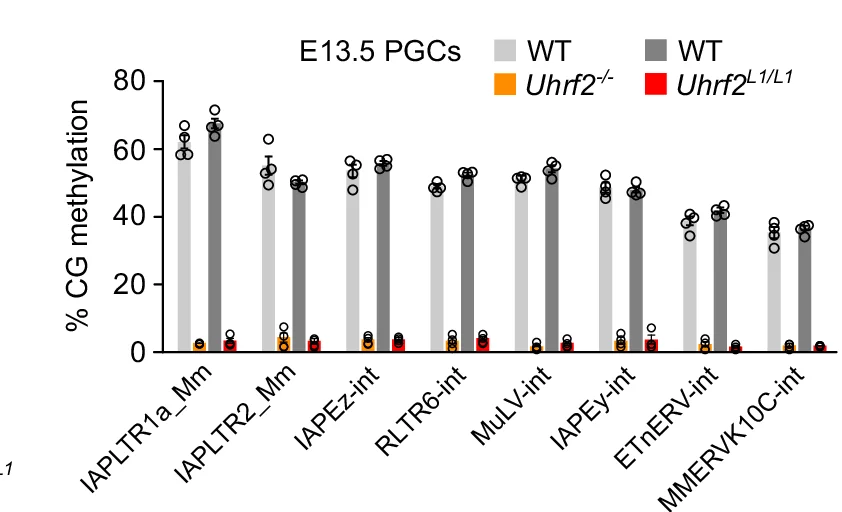
Mean methylation levels of ERV families in male and female Uhrf2 -/- and Uhrf2 L1/L1 compared to WT E13.5 PGCs (mean ± SEM, n = 4 embryos per genotype).
Related Plots
Browse by Category
Popular Collections
Related Tags
Discover More Scientific Plots
Browse thousands of high-quality scientific visualizations from open-access research