Clustered from Scientific Research

CC-BY
42
Views
1
Likes
Citation
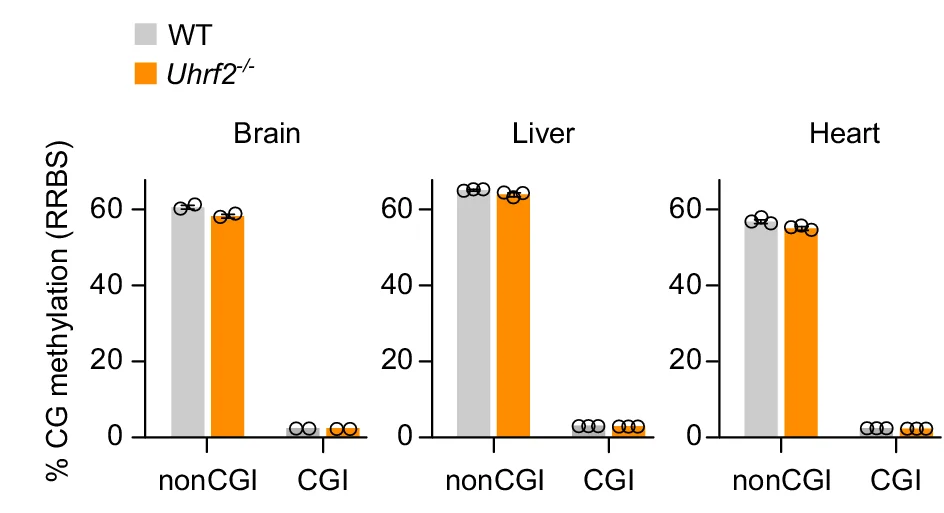
Quantification of CG methylation by RRBS in brain, liver and heart of Uhrf2 -/- compared to WT PND21 animals. Methylation levels are shown separately for CGs outside of CpG islands (non CGI) or in CpG islands (CGI). Data are presented as mean ± SEM ( n = 2 animals per genotype for brain, n = 3 animals for liver and heart).
#Clustered#Bar Plot#Scatter Plot#CG Methylation#RRBS#Brain#Liver#Heart#Uhrf2#PND21 Animals#CpG Islands
Related Plots
Browse by Category
Popular Collections
Related Tags
Discover More Scientific Plots
Browse thousands of high-quality scientific visualizations from open-access research