Line Plot from Scientific Research

CC-BY
43
Views
0
Likes
Citation
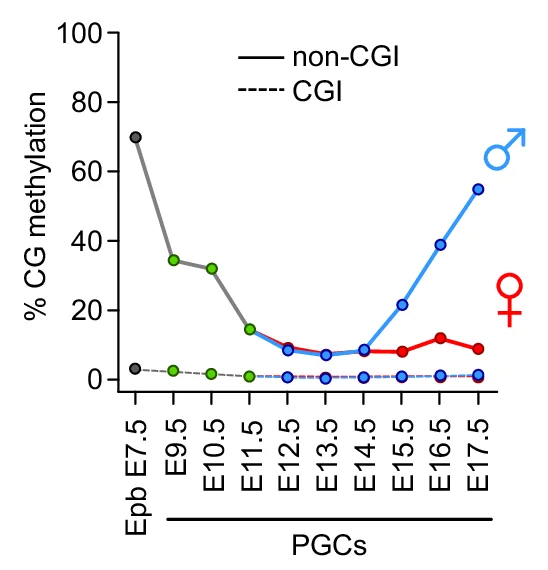
Global CG methylation levels measured by RRBS in E7.5 epiblast (Epb) and throughout PGC development. Methylation is represented separately for CGs in CpG islands (CGI, dashed lines) and outside of CpG islands (non-CGI, full lines). The average number of covered CpGs per sample is n = 599,050 for CGI and n = 560,437 for non-CGI.
Related Plots
Browse by Category
Popular Collections
Related Tags
Discover More Scientific Plots
Browse thousands of high-quality scientific visualizations from open-access research