Line Plot from Scientific Research

CC-BY
3
Views
0
Likes
Citation
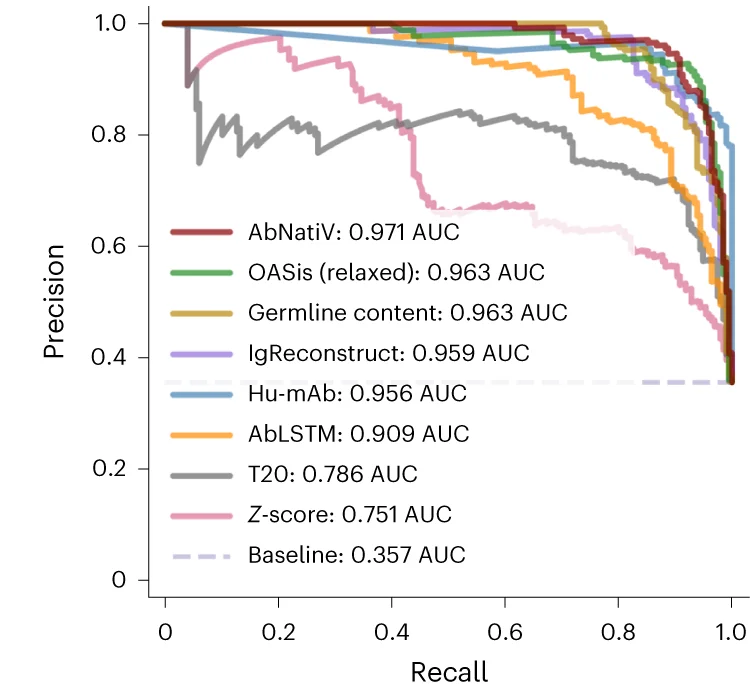
Plot of the PR curves of the classification of 196 human-derived therapeutics from 353 therapeutics of non-human origin (mouse, chimeric and humanized) carried out with AbNatiV (in red) and seven other computational methods (see legend, which also reports the AUC values). The baseline (dashed line) corresponds to the performance expected from a random classifier. Corresponding ROC curves can be found in Supplementary Fig. 10.
#Line Plot#PR Curves#Classification#Human-derived Therapeutics#Non-human origin Therapeutics#AbNatiV#Computational Methods#AUC#ROC Curves
Related Plots
Browse by Category
Popular Collections
Discover More Scientific Plots
Browse thousands of high-quality scientific visualizations from open-access research